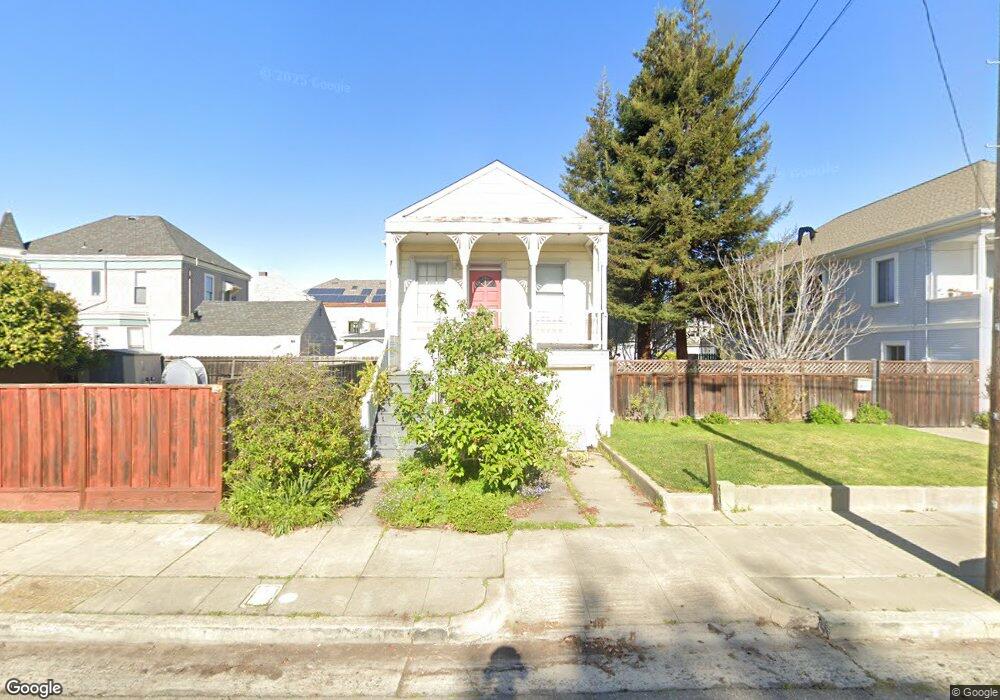
2509 Calhoun St Alameda, CA 94501
South Shore NeighborhoodEstimated Value: $857,402 - $1,041,000
2
Beds
1
Bath
828
Sq Ft
$1,130/Sq Ft
Est. Value
About This Home
This home is located at 2509 Calhoun St, Alameda, CA 94501 and is currently estimated at $935,351, approximately $1,129 per square foot. 2509 Calhoun St is a home located in Alameda County with nearby schools including Frank Otis Elementary School, Lincoln Middle School, and Alameda High School.
Ownership History
Date
Name
Owned For
Owner Type
Purchase Details
Closed on
Feb 8, 2002
Sold by
Hageman Randall
Bought by
Marcus Suzanne R
Current Estimated Value
Home Financials for this Owner
Home Financials are based on the most recent Mortgage that was taken out on this home.
Original Mortgage
$266,400
Outstanding Balance
$109,998
Interest Rate
7.04%
Estimated Equity
$825,353
Purchase Details
Closed on
Jan 9, 1997
Sold by
Christian Dennis R and Christian Sharon
Bought by
Hageman Randall J
Home Financials for this Owner
Home Financials are based on the most recent Mortgage that was taken out on this home.
Original Mortgage
$95,400
Interest Rate
7.46%
Mortgage Type
Balloon
Purchase Details
Closed on
Jul 25, 1996
Sold by
Tiedman Gladine N and Adkins Opal E
Bought by
Christian Dennis R and Christian Sharon
Home Financials for this Owner
Home Financials are based on the most recent Mortgage that was taken out on this home.
Original Mortgage
$45,000
Interest Rate
8.18%
Create a Home Valuation Report for This Property
The Home Valuation Report is an in-depth analysis detailing your home's value as well as a comparison with similar homes in the area
Home Values in the Area
Average Home Value in this Area
Purchase History
| Date | Buyer | Sale Price | Title Company |
|---|---|---|---|
| Marcus Suzanne R | -- | Placer Title Company | |
| Hageman Randall J | $106,000 | Placer Title Company | |
| Christian Dennis R | $125,000 | Fidelity National Title Co |
Source: Public Records
Mortgage History
| Date | Status | Borrower | Loan Amount |
|---|---|---|---|
| Open | Marcus Suzanne R | $266,400 | |
| Previous Owner | Hageman Randall J | $95,400 | |
| Previous Owner | Christian Dennis R | $45,000 | |
| Closed | Marcus Suzanne R | $66,600 |
Source: Public Records
Tax History Compared to Growth
Tax History
| Year | Tax Paid | Tax Assessment Tax Assessment Total Assessment is a certain percentage of the fair market value that is determined by local assessors to be the total taxable value of land and additions on the property. | Land | Improvement |
|---|---|---|---|---|
| 2025 | $7,405 | $484,907 | $147,572 | $344,335 |
| 2024 | $7,405 | $475,263 | $144,679 | $337,584 |
| 2023 | $7,126 | $472,810 | $141,843 | $330,967 |
| 2022 | $6,964 | $456,538 | $139,061 | $324,477 |
| 2021 | $6,793 | $447,451 | $136,335 | $318,116 |
| 2020 | $6,708 | $449,792 | $134,937 | $314,855 |
| 2019 | $6,412 | $440,974 | $132,292 | $308,682 |
| 2018 | $6,252 | $432,330 | $129,699 | $302,631 |
| 2017 | $5,973 | $423,855 | $127,156 | $296,699 |
| 2016 | $5,970 | $415,547 | $124,664 | $290,883 |
| 2015 | $5,947 | $409,306 | $122,792 | $286,514 |
| 2014 | $5,684 | $401,291 | $120,387 | $280,904 |
Source: Public Records
Map
Nearby Homes
- 1024 Regent St
- 1100 Park Ave
- 954 Park St
- 2431 Roosevelt Dr
- 840 Oak St
- 1222 Park Ave
- 1213 Park Ave
- 2620 Encinal Ave
- 1251 Park St
- 2848 San Jose Ave
- 2417 Marti Rae Ct
- 2209 Otis Dr Unit L
- 2308 Encinal Ave
- 3012 Bayview Dr
- 2137 Otis Dr Unit 111
- 3171 Bayview Dr
- 3208 Washington St
- 2106 Otis Dr Unit D
- 2101 Shore Line Dr Unit 212
- 2101 Shoreline Dr Unit 475
- 1100 Regent St
- 2513 Calhoun St
- 1108 Regent St
- 1114 Regent St
- 2517 Calhoun St
- 1038 Regent St
- 2521 Calhoun St
- 1118 Regent St
- 2512 Calhoun St
- 1036 Regent St
- 2516 Calhoun St
- 2527 Calhoun St
- 2524 Washington Way
- 2526 Washington Way
- 2524 Calhoun St
- 1032 Regent St
- 2528 Washington Way
- 1128 Regent St
- 2528 Calhoun St
- 1030 Regent St