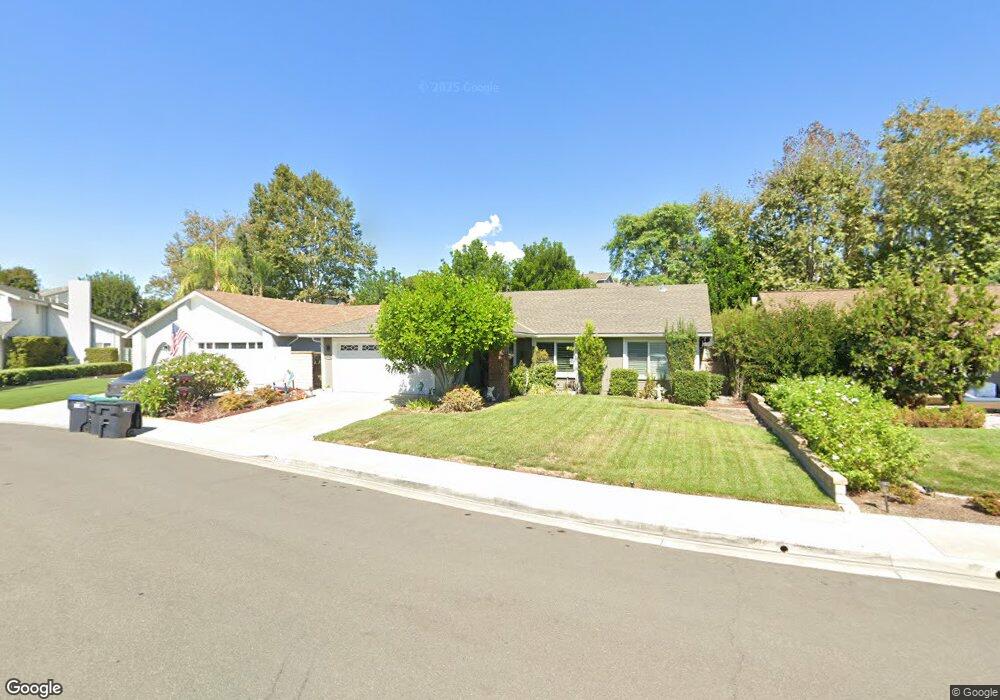
25096 Bellota Mission Viejo, CA 92692
Estimated Value: $1,169,966 - $1,343,000
3
Beds
2
Baths
1,546
Sq Ft
$802/Sq Ft
Est. Value
About This Home
This home is located at 25096 Bellota, Mission Viejo, CA 92692 and is currently estimated at $1,239,242, approximately $801 per square foot. 25096 Bellota is a home located in Orange County with nearby schools including Castille Elementary School, Newhart Middle School, and Capistrano Valley High School.
Ownership History
Date
Name
Owned For
Owner Type
Purchase Details
Closed on
Sep 10, 2021
Sold by
Meyer Anthony and Meyer Robin
Bought by
Meyer Anthony and Meyer Robin
Current Estimated Value
Purchase Details
Closed on
Jan 11, 1999
Sold by
Childers Frances E
Bought by
Meyer Anthony and Meyer Robin
Home Financials for this Owner
Home Financials are based on the most recent Mortgage that was taken out on this home.
Original Mortgage
$240,000
Outstanding Balance
$55,044
Interest Rate
6.63%
Estimated Equity
$1,184,198
Purchase Details
Closed on
Oct 18, 1993
Sold by
Troy Development Corp
Bought by
Childers Frances E
Home Financials for this Owner
Home Financials are based on the most recent Mortgage that was taken out on this home.
Original Mortgage
$170,000
Interest Rate
3.25%
Create a Home Valuation Report for This Property
The Home Valuation Report is an in-depth analysis detailing your home's value as well as a comparison with similar homes in the area
Home Values in the Area
Average Home Value in this Area
Purchase History
| Date | Buyer | Sale Price | Title Company |
|---|---|---|---|
| Meyer Anthony | -- | None Available | |
| Meyer Anthony | $256,000 | Guardian Title Company | |
| Childers Frances E | $190,000 | Chicago Title Company |
Source: Public Records
Mortgage History
| Date | Status | Borrower | Loan Amount |
|---|---|---|---|
| Open | Meyer Anthony | $240,000 | |
| Previous Owner | Childers Frances E | $170,000 |
Source: Public Records
Tax History Compared to Growth
Tax History
| Year | Tax Paid | Tax Assessment Tax Assessment Total Assessment is a certain percentage of the fair market value that is determined by local assessors to be the total taxable value of land and additions on the property. | Land | Improvement |
|---|---|---|---|---|
| 2025 | $3,930 | $401,327 | $274,742 | $126,585 |
| 2024 | $3,930 | $393,458 | $269,355 | $124,103 |
| 2023 | $3,845 | $385,744 | $264,074 | $121,670 |
| 2022 | $3,771 | $378,181 | $258,896 | $119,285 |
| 2021 | $3,697 | $370,766 | $253,819 | $116,947 |
| 2020 | $3,659 | $366,965 | $251,217 | $115,748 |
| 2019 | $3,586 | $359,770 | $246,291 | $113,479 |
| 2018 | $3,516 | $352,716 | $241,462 | $111,254 |
| 2017 | $3,446 | $345,800 | $236,727 | $109,073 |
| 2016 | $3,379 | $339,020 | $232,085 | $106,935 |
| 2015 | $3,343 | $333,928 | $228,599 | $105,329 |
| 2014 | $3,278 | $327,387 | $224,121 | $103,266 |
Source: Public Records
Map
Nearby Homes
- 27641 Ruisenor
- 27701 Pasatiempo
- 27661 Pasatiempo
- 25 Mirino Dr
- 25145 Darlington
- 27911 Sheffield
- 27782 Abadejo
- 25311 Misty Ridge
- 27951 Faroles
- 27821 Abadejo
- 27643 Via Granados
- 24362 Via Santa Clara
- 139 Melrose Dr
- 27751 Via Granados
- 24392 Macedo Dr
- 24375 Macedo Dr
- 27402 Carino Cir
- 16 Cambria Unit 32
- 25234 Terreno Dr
- 27748 Via Sarasate