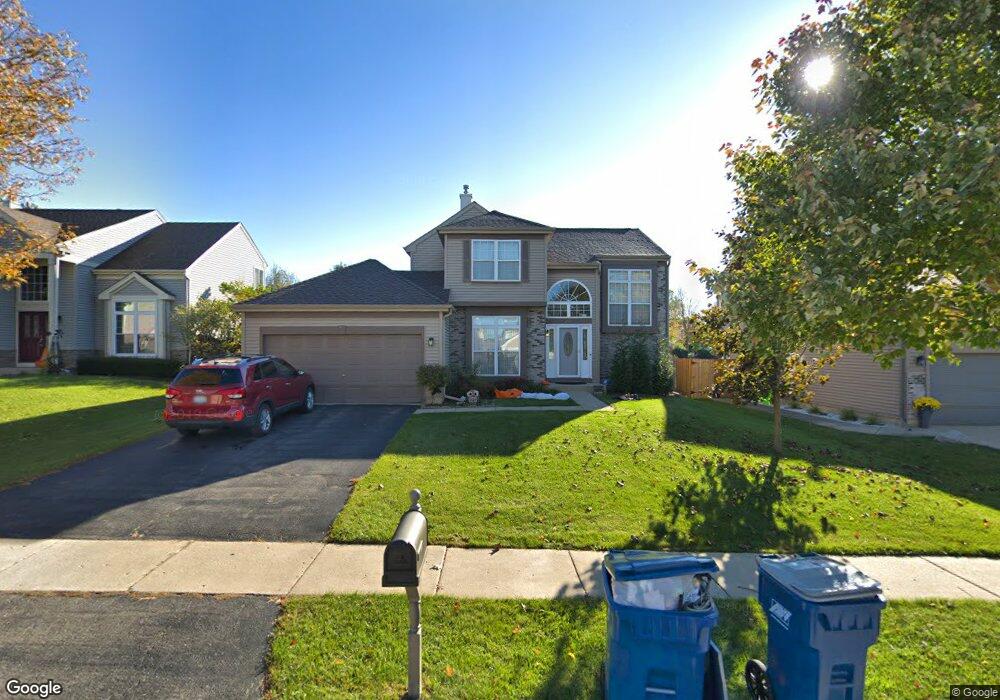
251 Cedarfield Dr Bartlett, IL 60103
Estimated Value: $352,000 - $436,000
3
Beds
3
Baths
1,593
Sq Ft
$255/Sq Ft
Est. Value
About This Home
This home is located at 251 Cedarfield Dr, Bartlett, IL 60103 and is currently estimated at $406,498, approximately $255 per square foot. 251 Cedarfield Dr is a home located in Cook County with nearby schools including Nature Ridge Elementary School, Kenyon Woods Middle School, and South Elgin High School.
Ownership History
Date
Name
Owned For
Owner Type
Purchase Details
Closed on
Jul 28, 2008
Sold by
Merlino Cherri
Bought by
Mcalpine Patrick D and Mcalpine Kimberley
Current Estimated Value
Home Financials for this Owner
Home Financials are based on the most recent Mortgage that was taken out on this home.
Original Mortgage
$272,175
Outstanding Balance
$176,151
Interest Rate
6.39%
Mortgage Type
Unknown
Estimated Equity
$230,347
Purchase Details
Closed on
Mar 31, 2002
Sold by
Mitchell Dale M and Mitchell Christina M
Bought by
Merlino Cherri
Home Financials for this Owner
Home Financials are based on the most recent Mortgage that was taken out on this home.
Original Mortgage
$182,250
Interest Rate
6.87%
Purchase Details
Closed on
Dec 12, 1995
Sold by
Centex Real Estate Corp
Bought by
Mitchell Dale M and Mitchell Christina M
Home Financials for this Owner
Home Financials are based on the most recent Mortgage that was taken out on this home.
Original Mortgage
$138,643
Interest Rate
7.41%
Create a Home Valuation Report for This Property
The Home Valuation Report is an in-depth analysis detailing your home's value as well as a comparison with similar homes in the area
Home Values in the Area
Average Home Value in this Area
Purchase History
| Date | Buyer | Sale Price | Title Company |
|---|---|---|---|
| Mcalpine Patrick D | $286,500 | Pntn | |
| Merlino Cherri | $243,000 | -- | |
| Mitchell Dale M | $173,500 | -- |
Source: Public Records
Mortgage History
| Date | Status | Borrower | Loan Amount |
|---|---|---|---|
| Open | Mcalpine Patrick D | $272,175 | |
| Previous Owner | Merlino Cherri | $182,250 | |
| Previous Owner | Mitchell Dale M | $138,643 |
Source: Public Records
Tax History
| Year | Tax Paid | Tax Assessment Tax Assessment Total Assessment is a certain percentage of the fair market value that is determined by local assessors to be the total taxable value of land and additions on the property. | Land | Improvement |
|---|---|---|---|---|
| 2025 | $8,318 | $38,000 | $7,475 | $30,525 |
| 2024 | $8,318 | $30,323 | $6,354 | $23,969 |
| 2023 | $8,012 | $30,323 | $6,354 | $23,969 |
| 2022 | $8,012 | $30,323 | $6,354 | $23,969 |
| 2021 | $8,112 | $24,677 | $5,606 | $19,071 |
| 2020 | $8,077 | $24,677 | $5,606 | $19,071 |
| 2019 | $8,008 | $27,419 | $5,606 | $21,813 |
| 2018 | $7,635 | $24,391 | $4,858 | $19,533 |
| 2017 | $7,523 | $24,391 | $4,858 | $19,533 |
| 2016 | $7,320 | $24,391 | $4,858 | $19,533 |
| 2015 | $6,988 | $21,915 | $4,298 | $17,617 |
| 2014 | $6,915 | $21,915 | $4,298 | $17,617 |
| 2013 | $6,621 | $21,915 | $4,298 | $17,617 |
Source: Public Records
Map
Nearby Homes
- 220 Carroll Way
- 2068 Norwich Dr
- 1969 Osprey Ct Unit 223
- 1916 Blue Heron Cir
- 127 5th Ave
- 106 8th Ave
- 1627 Spaulding Rd Unit 524
- 485 Topaz Ln
- 995 Bluff Quarry Dr
- 19 N East Ave
- 1088 Center Dr
- 529 Rose Ln
- 645 E State St
- 303 Ann St
- 3 S South Elgin Blvd
- 521 E Spring Ave
- 720 Thornbury Rd Unit 1115
- 1701 Deer Pointe Dr
- 1040 Moraine Dr
- 1004 Atterberg Rd
- 247 Cedarfield Dr
- 255 Cedarfield Dr
- 1992 Westridge Blvd
- 243 Cedarfield Dr
- 259 Cedarfield Dr
- 1988 Westridge Blvd
- 248 Cedarfield Dr
- 252 Cedarfield Dr
- 244 Cedarfield Dr Unit 2
- 239 Cedarfield Dr
- 2020 Westridge Blvd
- 1984 Westridge Blvd
- 240 Cedarfield Dr
- 2024 Westridge Blvd
- 235 Cedarfield Dr
- 1980 Westridge Blvd
- 249 Norwich Dr
- 245 Norwich Dr
- 236 Cedarfield Dr
- 1991 Westridge Blvd
Your Personal Tour Guide
Ask me questions while you tour the home.