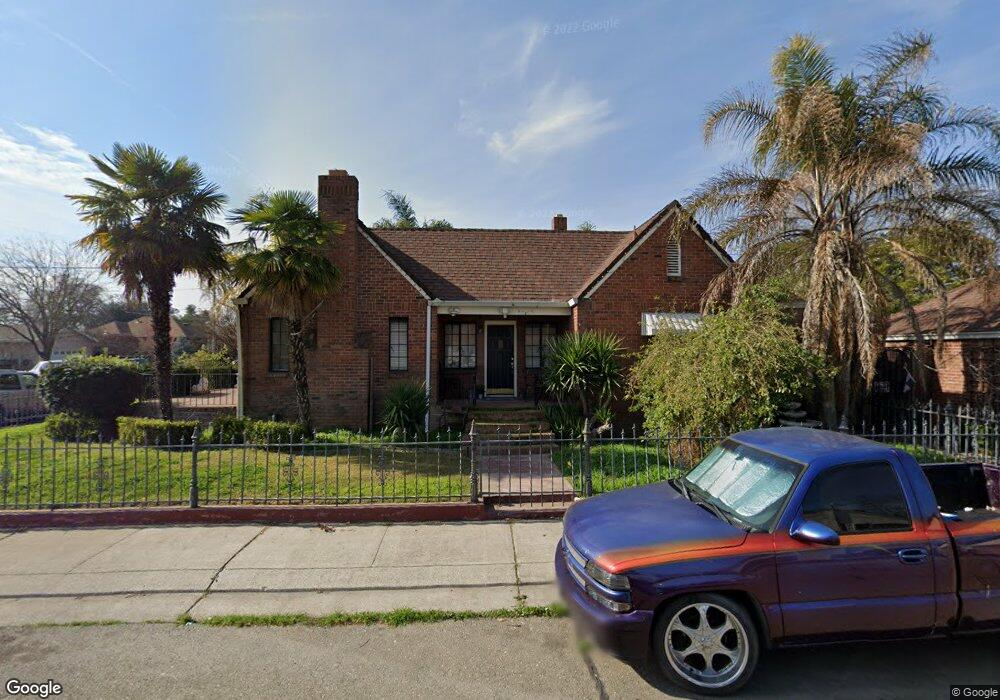
251 E Knoles Way Stockton, CA 95204
Midtown NeighborhoodEstimated Value: $445,000 - $500,000
4
Beds
3
Baths
1,850
Sq Ft
$254/Sq Ft
Est. Value
About This Home
This home is located at 251 E Knoles Way, Stockton, CA 95204 and is currently estimated at $470,562, approximately $254 per square foot. 251 E Knoles Way is a home located in San Joaquin County with nearby schools including Cleveland Elementary School, Wilson Elementary School, and El Dorado Elementary School.
Ownership History
Date
Name
Owned For
Owner Type
Purchase Details
Closed on
Feb 22, 2018
Sold by
Cervantes Armando and Lopez Mayra V
Bought by
Cervantes Armando
Current Estimated Value
Home Financials for this Owner
Home Financials are based on the most recent Mortgage that was taken out on this home.
Original Mortgage
$157,000
Outstanding Balance
$134,050
Interest Rate
4.32%
Mortgage Type
New Conventional
Estimated Equity
$336,512
Purchase Details
Closed on
Sep 25, 2010
Sold by
Gann Investments Llc
Bought by
Cervantes Armando and Lopez Mayra V
Home Financials for this Owner
Home Financials are based on the most recent Mortgage that was taken out on this home.
Original Mortgage
$173,661
Interest Rate
4.75%
Mortgage Type
FHA
Purchase Details
Closed on
Jun 3, 2010
Sold by
Vargas Guadalupe and Vargas Virginia
Bought by
Gann Investments Llc
Create a Home Valuation Report for This Property
The Home Valuation Report is an in-depth analysis detailing your home's value as well as a comparison with similar homes in the area
Home Values in the Area
Average Home Value in this Area
Purchase History
| Date | Buyer | Sale Price | Title Company |
|---|---|---|---|
| Cervantes Armando | -- | First American Title Company | |
| Cervantes Armando | $176,000 | Old Republic Title Company | |
| Gann Investments Llc | $98,000 | Chicago Title Company |
Source: Public Records
Mortgage History
| Date | Status | Borrower | Loan Amount |
|---|---|---|---|
| Open | Cervantes Armando | $157,000 | |
| Closed | Cervantes Armando | $173,661 |
Source: Public Records
Tax History
| Year | Tax Paid | Tax Assessment Tax Assessment Total Assessment is a certain percentage of the fair market value that is determined by local assessors to be the total taxable value of land and additions on the property. | Land | Improvement |
|---|---|---|---|---|
| 2025 | $2,832 | $225,473 | $56,366 | $169,107 |
| 2024 | $2,787 | $221,053 | $55,261 | $165,792 |
| 2023 | $2,724 | $216,720 | $54,178 | $162,542 |
| 2022 | $2,658 | $212,471 | $53,116 | $159,355 |
| 2021 | $2,554 | $208,306 | $52,075 | $156,231 |
| 2020 | $2,604 | $206,172 | $51,542 | $154,630 |
| 2019 | $2,594 | $202,131 | $50,532 | $151,599 |
| 2018 | $2,546 | $198,169 | $49,542 | $148,627 |
| 2017 | $2,412 | $194,284 | $48,571 | $145,713 |
| 2016 | $2,456 | $190,476 | $47,619 | $142,857 |
| 2014 | $2,336 | $183,941 | $45,985 | $137,956 |
Source: Public Records
Map
Nearby Homes
- 321 E Euclid Ave
- 3427 N Hunter St
- 3707 N California St
- 129 E Sonoma Ave
- 122 E Monterey Ave
- 303 E Arcade St
- 2820 N El Dorado St
- 3026 N American St
- 312 E Noble St
- 6 W Fargo St
- 4119 N Commerce St
- 116 E Noble St
- 3227 Bonnie Ln
- 61 E Ellis St
- 710 Fargo St
- 39 W Ingram St
- 11 E Geary St
- 719 Beeler St
- 4452 Cotton Ct
- 450 Bristol Ave
- 252 E Grove St
- 238 E Grove St
- 227 E Knoles Way
- 234 E Knoles Way
- 3535 N San Joaquin St
- 220 E Grove St
- 306 E Grove St
- 226 E Knoles Way
- 215 E Knoles Way
- 3530 N San Joaquin St
- 214 E Knoles Way
- 317 E Knoles Way
- 216 E Grove St
- 310 E Knoles Way
- 314 E Grove St
- 249 E Grove St
- 210 E Knoles Way
- 239 E Grove St
- 330 E Knoles Way
- 205 E Knoles Way
Your Personal Tour Guide
Ask me questions while you tour the home.