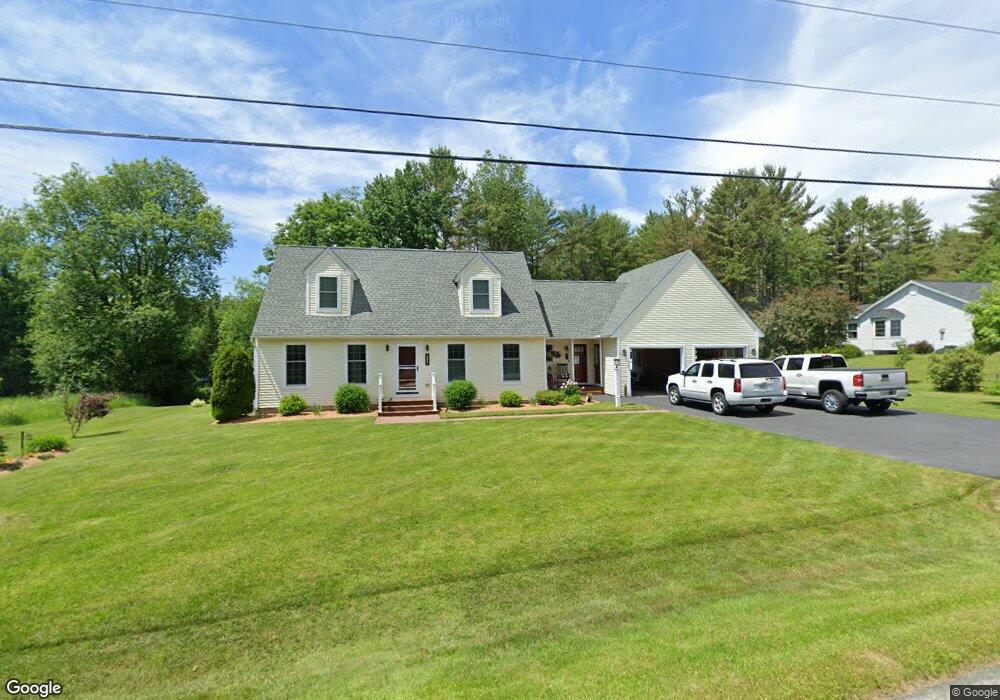
251 Elm St Littleton, NH 03561
Estimated Value: $467,328 - $529,000
3
Beds
3
Baths
1,873
Sq Ft
$266/Sq Ft
Est. Value
About This Home
This home is located at 251 Elm St, Littleton, NH 03561 and is currently estimated at $498,832, approximately $266 per square foot. 251 Elm St is a home located in Grafton County with nearby schools including Mildred C. Lakeway School, North Country Charter Academy (M), and North Country Charter Academy.
Ownership History
Date
Name
Owned For
Owner Type
Purchase Details
Closed on
Jan 16, 2001
Sold by
Farquharson Roger S
Bought by
Pilotte Russell S and Pilotte Katherine M
Current Estimated Value
Home Financials for this Owner
Home Financials are based on the most recent Mortgage that was taken out on this home.
Original Mortgage
$100,000
Outstanding Balance
$37,164
Interest Rate
7.64%
Estimated Equity
$461,668
Create a Home Valuation Report for This Property
The Home Valuation Report is an in-depth analysis detailing your home's value as well as a comparison with similar homes in the area
Home Values in the Area
Average Home Value in this Area
Purchase History
| Date | Buyer | Sale Price | Title Company |
|---|---|---|---|
| Pilotte Russell S | $164,700 | -- |
Source: Public Records
Mortgage History
| Date | Status | Borrower | Loan Amount |
|---|---|---|---|
| Open | Pilotte Russell S | $15,000 | |
| Open | Pilotte Russell S | $100,000 |
Source: Public Records
Tax History Compared to Growth
Tax History
| Year | Tax Paid | Tax Assessment Tax Assessment Total Assessment is a certain percentage of the fair market value that is determined by local assessors to be the total taxable value of land and additions on the property. | Land | Improvement |
|---|---|---|---|---|
| 2024 | $6,522 | $261,500 | $35,000 | $226,500 |
| 2023 | $5,894 | $261,500 | $35,000 | $226,500 |
| 2022 | $6,030 | $261,500 | $35,000 | $226,500 |
| 2021 | $6,030 | $261,500 | $35,000 | $226,500 |
| 2020 | $5,661 | $261,500 | $35,000 | $226,500 |
| 2019 | $5,408 | $234,100 | $32,100 | $202,000 |
| 2018 | $5,408 | $234,100 | $32,100 | $202,000 |
| 2017 | $5,525 | $214,000 | $33,900 | $180,100 |
| 2016 | $5,545 | $214,000 | $33,900 | $180,100 |
| 2015 | $5,401 | $231,600 | $38,300 | $193,300 |
| 2014 | $5,142 | $231,600 | $38,300 | $193,300 |
| 2013 | $5,179 | $230,600 | $38,300 | $192,300 |
Source: Public Records
Map
Nearby Homes
- 194 Main St
- 93 Pleasant St
- 45 Point of View Dr
- 33 Pleasant St
- 34 Union St
- 60-70 Meadow St
- 166 Riverside Dr
- 134 Cottage St
- 180 Beacon St
- 114 Highland Ave
- 11 Richmond St
- 92-29 Birchcroft Dr
- 36 MacIver Rd
- 000 Dells Rd Unit 1
- 191 Washington St
- 14 Hilltop Manor Mobile Home Park
- 456 Brickyard Rd
- 165 Bethlehem Rd
- 251 Bethlehem Rd
- 295 Old Waterford Rd