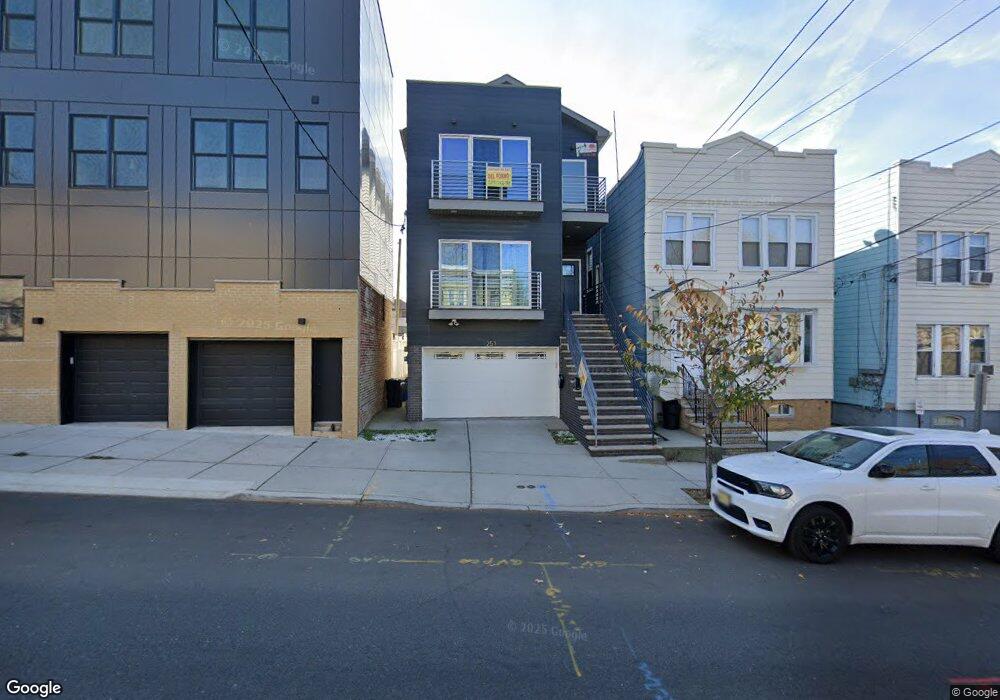
251 Manhattan Ave Jersey City, NJ 07307
Journal Square NeighborhoodEstimated Value: $911,000 - $1,456,000
4
Beds
--
Bath
1,340
Sq Ft
$850/Sq Ft
Est. Value
About This Home
This home is located at 251 Manhattan Ave, Jersey City, NJ 07307 and is currently estimated at $1,138,357, approximately $849 per square foot. 251 Manhattan Ave is a home located in Hudson County with nearby schools including Nicolas Copernicus No. 25 Elementary School, Anthony J. Infante No. 31 Elementary School, and William L. Dickinson High School.
Ownership History
Date
Name
Owned For
Owner Type
Purchase Details
Closed on
Sep 30, 2021
Sold by
Praveen Bethoju
Bought by
Bethoju Praveen and Gambiraopeta Srigowri
Current Estimated Value
Home Financials for this Owner
Home Financials are based on the most recent Mortgage that was taken out on this home.
Original Mortgage
$828,500
Interest Rate
2.8%
Mortgage Type
New Conventional
Purchase Details
Closed on
Oct 24, 2019
Sold by
Patel Pramod
Bought by
Bethoju Praveen
Home Financials for this Owner
Home Financials are based on the most recent Mortgage that was taken out on this home.
Original Mortgage
$833,000
Interest Rate
3.65%
Mortgage Type
New Conventional
Purchase Details
Closed on
Jan 26, 2018
Sold by
Genes George M
Bought by
Patel Pramod
Create a Home Valuation Report for This Property
The Home Valuation Report is an in-depth analysis detailing your home's value as well as a comparison with similar homes in the area
Home Values in the Area
Average Home Value in this Area
Purchase History
| Date | Buyer | Sale Price | Title Company |
|---|---|---|---|
| Bethoju Praveen | -- | Daley Rachel | |
| Bethoju Praveen | -- | None Listed On Document | |
| Bethoju Praveen | $980,000 | First American Title Ins Co | |
| Patel Pramod | $320,000 | All Jersey Title Llc |
Source: Public Records
Mortgage History
| Date | Status | Borrower | Loan Amount |
|---|---|---|---|
| Previous Owner | Bethoju Praveen | $828,500 | |
| Previous Owner | Bethoju Praveen | $833,000 |
Source: Public Records
Tax History Compared to Growth
Tax History
| Year | Tax Paid | Tax Assessment Tax Assessment Total Assessment is a certain percentage of the fair market value that is determined by local assessors to be the total taxable value of land and additions on the property. | Land | Improvement |
|---|---|---|---|---|
| 2025 | $17,641 | $1,000,000 | $300,000 | $700,000 |
| 2024 | $17,751 | $790,000 | $300,000 | $700,000 |
| 2023 | $17,751 | $790,000 | $0 | $0 |
| 2022 | $16,732 | $790,000 | $0 | $0 |
| 2021 | $12,672 | $790,000 | $0 | $0 |
| 2020 | $12,719 | $790,000 | $0 | $0 |
| 2019 | $11,088 | $720,000 | $320,000 | $400,000 |
| 2018 | $1,190 | $357,000 | $180,000 | $177,000 |
| 2017 | $6,240 | $80,000 | $20,000 | $60,000 |
| 2016 | $6,161 | $80,000 | $20,000 | $60,000 |
| 2015 | $5,986 | $80,000 | $20,000 | $60,000 |
| 2014 | $5,947 | $80,000 | $20,000 | $60,000 |
Source: Public Records
Map
Nearby Homes
- 259 Liberty Ave Unit 3
- 259 Liberty Ave Unit 1
- 259 Liberty Ave Unit 2
- 259 Liberty Ave Unit 4
- 152 Beach St Unit 1
- 168 Carlton Ave
- 40 Terrace Ave
- 46 Western Ave
- 47 Terrace Ave
- 310 Liberty Ave
- 187 Zabriskie St
- 201 Zabriskie St Unit 1
- 182 Zabriskie St
- 84 Terrace Ave Unit 1
- 84 Terrace Ave Unit 2
- 84 Terrace Ave
- 3211 John F. Kennedy Blvd
- 1512 Manhattan Ave
- 93 Terrace Ave Unit 2
- 131 Zabriskie St Unit 1
- 251 Manhattan Ave Unit 2
- 253 Manhattan Ave
- 255 Manhattan Ave
- 245 Manhattan Ave Unit 3
- 245 Manhattan Ave Unit 1
- 245 Manhattan Ave Unit 1A
- 245 Manhattan Ave Unit 3A
- 245 Manhattan Ave Unit 4
- 245 Manhattan Ave Unit 2
- 257 Liberty Ave
- 257 Manhattan Ave Unit 1
- 257 Manhattan Ave Unit 2
- 257 Manhattan Ave
- 255 Liberty Ave
- 259 Liberty Ave
- 243 Manhattan Ave
- 253 Liberty Ave
- 259 Manhattan Ave
- 259 Manhattan Ave Unit L
- 259 Manhattan Ave Unit 1