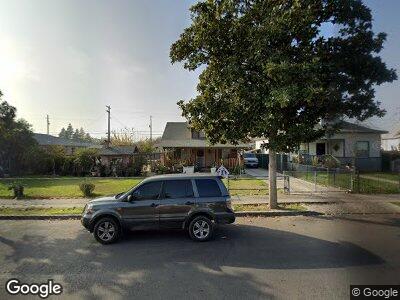
251 N San Pablo Ave Fresno, CA 93701
Lowell NeighborhoodEstimated Value: $224,000 - $270,000
3
Beds
1
Bath
1,100
Sq Ft
$219/Sq Ft
Est. Value
About This Home
This home is located at 251 N San Pablo Ave, Fresno, CA 93701 and is currently estimated at $240,713, approximately $218 per square foot. 251 N San Pablo Ave is a home located in Fresno County with nearby schools including Lowell Elementary School, Tehipite Middle School, and Roosevelt High School.
Ownership History
Date
Name
Owned For
Owner Type
Purchase Details
Closed on
Sep 1, 2005
Sold by
Ruiz Eduardo
Bought by
Gomez Sergio
Current Estimated Value
Home Financials for this Owner
Home Financials are based on the most recent Mortgage that was taken out on this home.
Original Mortgage
$36,000
Interest Rate
5.27%
Mortgage Type
Stand Alone Second
Purchase Details
Closed on
Feb 11, 2005
Sold by
Garcia Ana
Bought by
Costa Don and Lopez Alex
Purchase Details
Closed on
Jun 2, 1998
Sold by
Alexander Richard S Living Trust and Kerber Ruthann
Bought by
Garcia David Brambila and Garcia Ana
Home Financials for this Owner
Home Financials are based on the most recent Mortgage that was taken out on this home.
Original Mortgage
$34,000
Interest Rate
7.06%
Mortgage Type
Seller Take Back
Create a Home Valuation Report for This Property
The Home Valuation Report is an in-depth analysis detailing your home's value as well as a comparison with similar homes in the area
Home Values in the Area
Average Home Value in this Area
Purchase History
| Date | Buyer | Sale Price | Title Company |
|---|---|---|---|
| Gomez Sergio | $180,000 | First American Title Ins Co | |
| Costa Don | -- | -- | |
| Costa Don | -- | -- | |
| Garcia David Brambila | $34,000 | First American Title Co |
Source: Public Records
Mortgage History
| Date | Status | Borrower | Loan Amount |
|---|---|---|---|
| Closed | Gomez Sergio | $36,000 | |
| Open | Gomez Sergio | $144,000 | |
| Previous Owner | Garcia David | $15,000 | |
| Previous Owner | Garcia David Brambila | $34,000 |
Source: Public Records
Tax History Compared to Growth
Tax History
| Year | Tax Paid | Tax Assessment Tax Assessment Total Assessment is a certain percentage of the fair market value that is determined by local assessors to be the total taxable value of land and additions on the property. | Land | Improvement |
|---|---|---|---|---|
| 2023 | $1,505 | $117,201 | $29,204 | $87,997 |
| 2022 | $1,484 | $114,904 | $28,632 | $86,272 |
| 2021 | $1,444 | $112,652 | $28,071 | $84,581 |
| 2020 | $1,437 | $111,498 | $27,784 | $83,714 |
| 2019 | $1,382 | $109,313 | $27,240 | $82,073 |
| 2018 | $1,352 | $107,170 | $26,706 | $80,464 |
| 2017 | $1,329 | $105,070 | $26,183 | $78,887 |
| 2016 | $1,286 | $103,011 | $25,670 | $77,341 |
| 2015 | $1,266 | $101,465 | $25,285 | $76,180 |
| 2014 | $1,240 | $99,478 | $24,790 | $74,688 |
Source: Public Records
Map
Nearby Homes
- 315 N San Pablo Ave Unit 101
- 329 N Glenn Ave
- 186 N College Ave
- 458250 Divisadero St
- 289 N Calaveras St
- 385 N San Pablo Ave
- 159 N College Ave
- 2235 San Joaquin St
- 426 N Poplar Ave
- 114 N Van Ness Ave
- 333 N Blackstone Ave
- 340 N Fulton St
- 540 E Belmont Ave
- 452 N Calaveras St
- 330 N Abby St
- 231 N Effie St
- 337 N Effie St Unit 101
- 604 N Poplar Ave
- 320 N Effie St
- 635 N San Pablo Ave
- 251 N San Pablo Ave
- 257 N San Pablo Ave
- 205 N San Pablo Ave
- 252 N Poplar Ave
- 209 N San Pablo Ave
- 244 N Poplar Ave
- 260 N Poplar Ave
- 203 N San Pablo Ave
- 277 N San Pablo Ave
- 268 N Poplar Ave
- 246 N San Pablo Ave
- 256 N San Pablo Ave
- 242 N San Pablo Ave
- 266 N San Pablo Ave
- 283 N San Pablo Ave
- 276 N Poplar Ave
- 230 N San Pablo Ave
- 236 N San Pablo Ave
- 286 N Poplar Ave
- 224 N San Pablo Ave