Estimated Value: $523,000 - $580,000
4
Beds
4
Baths
2,500
Sq Ft
$220/Sq Ft
Est. Value
About This Home
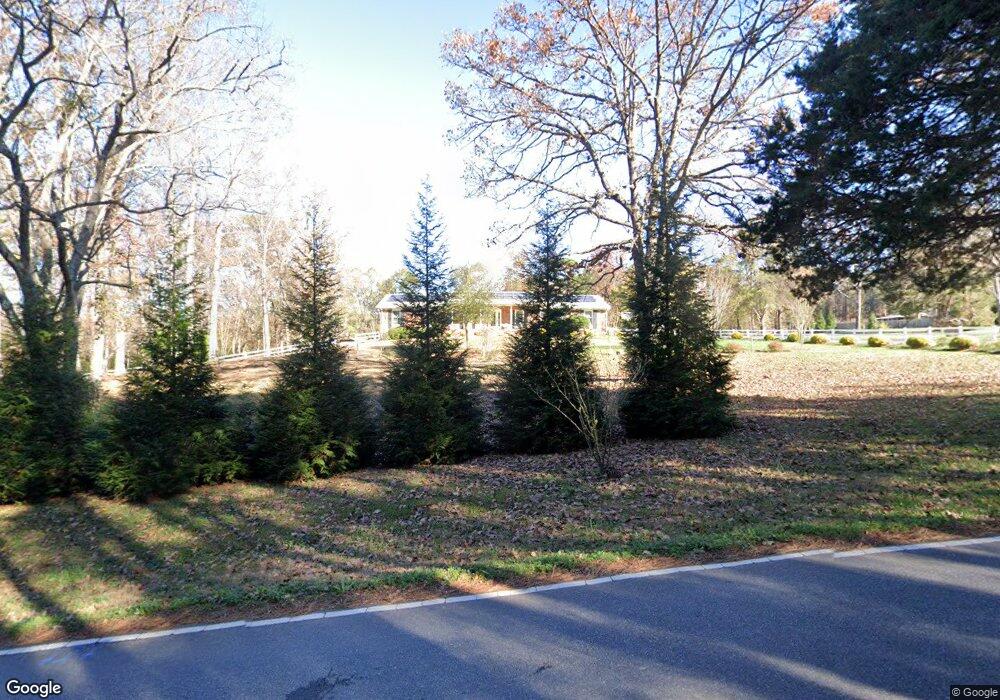
This home is located at 251 Sundyal Dr, Moore, SC 29369 and is currently estimated at $549,131, approximately $219 per square foot. 251 Sundyal Dr is a home located in Spartanburg County with nearby schools including Dorman High School Freshman Campus, Dorman High School, and GREEN Charter School Spartanburg.
Ownership History
Date
Name
Owned For
Owner Type
Purchase Details
Closed on
Mar 13, 2014
Sold by
Krajnik James and Krajnik Roberta
Bought by
Krajnik James J and Krajnik Roberta B
Current Estimated Value
Purchase Details
Closed on
Aug 18, 2011
Sold by
Bond William A
Bought by
Krajnik James and Krajnik Roberta
Home Financials for this Owner
Home Financials are based on the most recent Mortgage that was taken out on this home.
Original Mortgage
$300,675
Outstanding Balance
$207,795
Interest Rate
4.53%
Mortgage Type
Future Advance Clause Open End Mortgage
Estimated Equity
$341,336
Purchase Details
Closed on
Feb 8, 2011
Sold by
Bond Dina A
Bought by
Bond William A
Purchase Details
Closed on
May 14, 2007
Sold by
Wall Freida
Bought by
Bond William A and Bond Dina A
Home Financials for this Owner
Home Financials are based on the most recent Mortgage that was taken out on this home.
Original Mortgage
$284,000
Interest Rate
6.17%
Mortgage Type
Purchase Money Mortgage
Create a Home Valuation Report for This Property
The Home Valuation Report is an in-depth analysis detailing your home's value as well as a comparison with similar homes in the area
Home Values in the Area
Average Home Value in this Area
Purchase History
| Date | Buyer | Sale Price | Title Company |
|---|---|---|---|
| Krajnik James J | -- | -- | |
| Krajnik James | $316,500 | -- | |
| Bond William A | -- | -- | |
| Bond William A | $284,000 | None Available |
Source: Public Records
Mortgage History
| Date | Status | Borrower | Loan Amount |
|---|---|---|---|
| Open | Krajnik James | $300,675 | |
| Previous Owner | Bond William A | $284,000 |
Source: Public Records
Tax History Compared to Growth
Tax History
| Year | Tax Paid | Tax Assessment Tax Assessment Total Assessment is a certain percentage of the fair market value that is determined by local assessors to be the total taxable value of land and additions on the property. | Land | Improvement |
|---|---|---|---|---|
| 2025 | $2,539 | $17,385 | $3,924 | $13,461 |
| 2024 | $2,539 | $17,385 | $3,924 | $13,461 |
| 2023 | $2,539 | $17,385 | $3,924 | $13,461 |
| 2022 | $2,653 | $15,117 | $4,359 | $10,758 |
| 2021 | $2,653 | $15,117 | $4,359 | $10,758 |
| 2020 | $2,593 | $15,117 | $4,359 | $10,758 |
| 2019 | $2,570 | $15,117 | $4,359 | $10,758 |
| 2018 | $2,580 | $15,316 | $4,416 | $10,900 |
| 2017 | $2,279 | $13,772 | $3,960 | $9,812 |
| 2016 | $2,231 | $13,772 | $3,960 | $9,812 |
| 2015 | $2,009 | $12,229 | $3,516 | $8,713 |
| 2014 | $1,948 | $12,229 | $3,516 | $8,713 |
Source: Public Records
Map
Nearby Homes
- 4024 Pebblebrook Ct
- 126 Jay Cir
- 1825 Betsy Ross Dr
- 1824 Betsy Ross Dr
- 1821 Betsy Ross Dr
- 1820 Betsy Ross Dr
- 1817 Betsy Ross Dr
- 1813 Betsy Ross Dr
- 405 Prosperity Ln
- 217 Braxton Dr
- 400 Prosperity Ln
- 209 Braxton Dr
- 201 Braxton Dr
- 1716 Constitution Ln
- 208 Braxton Dr
- 377 Prosperity Ln
- 1720 Constitution Ln
- 4784 Worden Dr
- 267 Sundyal Dr
- 4001 Pebblebrook Ct
- 4005 Pebblebrook Ct
- 4009 Pebblebrook Ct
- 266 Sundyal Dr
- 4785 Worden Dr
- 4011 Pebblebrook Ct
- 4781 Worden Dr
- 4776B Worden Dr
- 4776 Worden Dr
- 4004 Pebblebrook Ct
- 4777 Worden Dr
- 4006 Pebblebrook Ct
- 4013 Pebblebrook Ct
- 4013 Pebblebrook Ct Unit A
- 4008 Pebblecreeek Ct
- 4008 Pebblebrook Ct
- 4772 Worden Dr
- 4775 Worden Dr