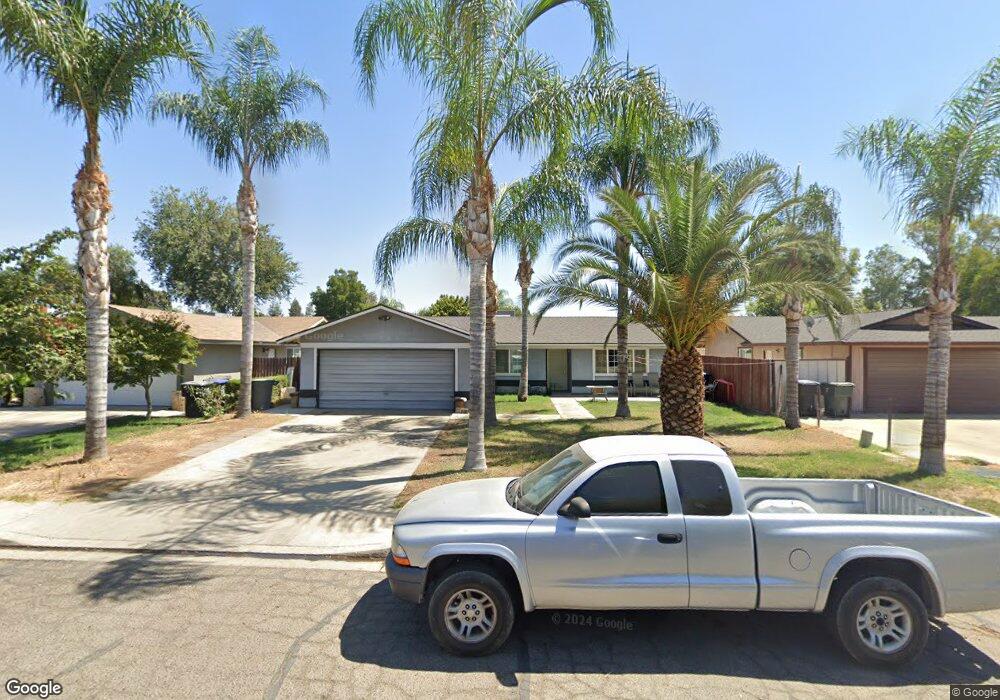
2510 N Mora Ct Visalia, CA 93291
North Visalia NeighborhoodEstimated Value: $237,000 - $312,000
3
Beds
2
Baths
1,100
Sq Ft
$251/Sq Ft
Est. Value
About This Home
This home is located at 2510 N Mora Ct, Visalia, CA 93291 and is currently estimated at $276,551, approximately $251 per square foot. 2510 N Mora Ct is a home located in Tulare County with nearby schools including Crowley Elementary School, Divisadero Middle School, and Mt. Whitney High School.
Ownership History
Date
Name
Owned For
Owner Type
Purchase Details
Closed on
Aug 6, 2009
Sold by
Rodriguez Christina
Bought by
Rodriguez Saul J
Current Estimated Value
Purchase Details
Closed on
May 29, 2009
Sold by
Gmac Mortgage Llc
Bought by
Rodriguez Saul J
Home Financials for this Owner
Home Financials are based on the most recent Mortgage that was taken out on this home.
Original Mortgage
$48,000
Interest Rate
5.3%
Mortgage Type
Purchase Money Mortgage
Purchase Details
Closed on
Jul 23, 2008
Sold by
Herrera Alfred N
Bought by
Gmac Mortgage Llc and Gmac Mortgage Corp
Purchase Details
Closed on
Jan 9, 1997
Sold by
Dominguez Stella
Bought by
Herrera Alfred N and Herrera Jodi
Home Financials for this Owner
Home Financials are based on the most recent Mortgage that was taken out on this home.
Original Mortgage
$76,500
Interest Rate
7.74%
Mortgage Type
VA
Create a Home Valuation Report for This Property
The Home Valuation Report is an in-depth analysis detailing your home's value as well as a comparison with similar homes in the area
Home Values in the Area
Average Home Value in this Area
Purchase History
| Date | Buyer | Sale Price | Title Company |
|---|---|---|---|
| Rodriguez Saul J | -- | First American Title Company | |
| Rodriguez Saul J | $60,000 | First American Title Company | |
| Gmac Mortgage Llc | $80,750 | First American Title Company | |
| Herrera Alfred N | $75,000 | Old Republic Title Company |
Source: Public Records
Mortgage History
| Date | Status | Borrower | Loan Amount |
|---|---|---|---|
| Previous Owner | Rodriguez Saul J | $48,000 | |
| Previous Owner | Herrera Alfred N | $76,500 |
Source: Public Records
Tax History Compared to Growth
Tax History
| Year | Tax Paid | Tax Assessment Tax Assessment Total Assessment is a certain percentage of the fair market value that is determined by local assessors to be the total taxable value of land and additions on the property. | Land | Improvement |
|---|---|---|---|---|
| 2025 | $826 | $77,448 | $38,724 | $38,724 |
| 2024 | $826 | $75,930 | $37,965 | $37,965 |
| 2023 | $803 | $74,442 | $37,221 | $37,221 |
| 2022 | $778 | $72,984 | $36,492 | $36,492 |
| 2021 | $768 | $71,552 | $35,776 | $35,776 |
| 2020 | $754 | $70,818 | $35,409 | $35,409 |
| 2019 | $741 | $69,430 | $34,715 | $34,715 |
| 2018 | $714 | $68,068 | $34,034 | $34,034 |
| 2017 | $715 | $66,734 | $33,367 | $33,367 |
| 2016 | $693 | $65,426 | $32,713 | $32,713 |
| 2015 | $674 | $64,444 | $32,222 | $32,222 |
| 2014 | $674 | $63,182 | $31,591 | $31,591 |
Source: Public Records
Map
Nearby Homes
- 607 E Oakridge Ct
- 625 E Ferguson Ave
- 2420 N Michael St
- 2948 N Church Ct
- 2435 N Clark St
- 2419 N Clark St
- 4106 E Oakridge Ave
- 4109 E Oakridge Ave
- 143 E Sedona Ave
- 2146 N Bridge St
- 223 W Buena Vista Ave
- 3310 N Church St
- 0 W Ferguson Ave Unit 214901
- 3336 N Moreno St
- 3325 N Church St
- 2218 N Oakhurst St
- 2241 N Edison St
- 1145 E Ferguson Ave
- 203 E Harold Ct
- 1633 N Tipton St
- 2522 N Mora Ct
- 2502 N Mora Ct Unit CTA
- 2502 N Mora Ct
- 2515 N Bridge St
- 2519 N Bridge St
- 2505 N Bridge St
- 2528 N Mora Ct
- 2521 N Bridge St
- 2509 N Mora Ct
- 2503 N Mora Ct
- 2521 N Mora Ct
- 2539 N Bridge St
- 325 E Modoc Ave
- 315 E Modoc Ave
- 333 E Modoc Ave
- 2536 N Mora Ct
- 2527 N Mora Ct
- 307 E Modoc Ave
- 2535 N Mora Ct
- 341 E Modoc Ave