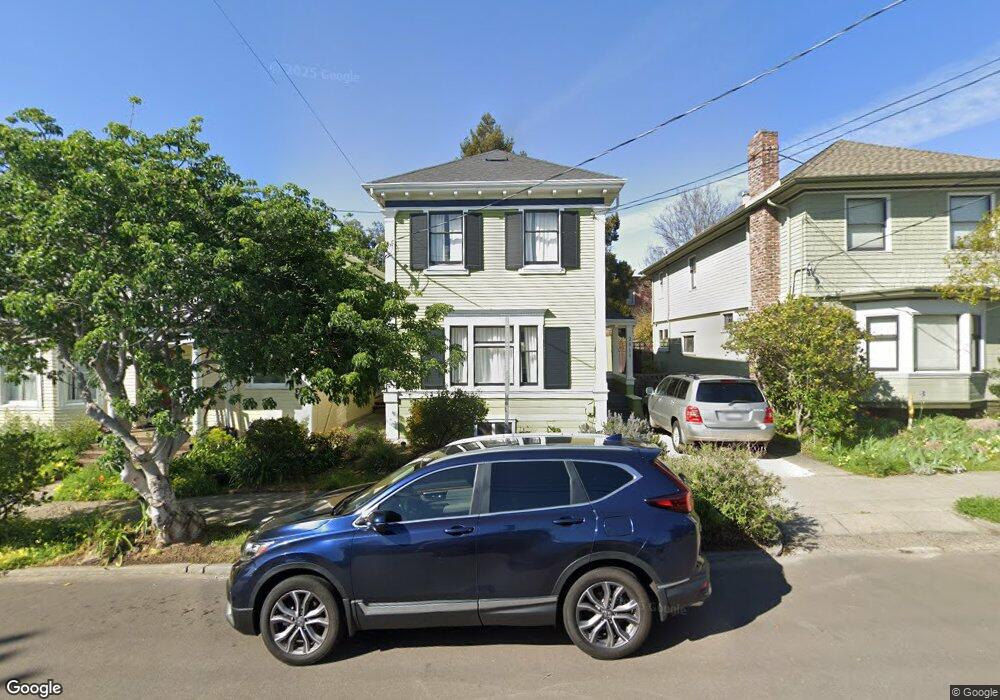
2511 Derby St Berkeley, CA 94705
Elmwood NeighborhoodEstimated Value: $1,844,000 - $2,022,000
4
Beds
3
Baths
2,064
Sq Ft
$938/Sq Ft
Est. Value
About This Home
This home is located at 2511 Derby St, Berkeley, CA 94705 and is currently estimated at $1,936,607, approximately $938 per square foot. 2511 Derby St is a home located in Alameda County with nearby schools including Emerson Elementary School, John Muir Elementary School, and Malcolm X Elementary School.
Ownership History
Date
Name
Owned For
Owner Type
Purchase Details
Closed on
Dec 5, 2017
Sold by
Mawson Christopher and Murphy Kristin Michelle
Bought by
Stauffer Zachary Jakob and Stauffer Amy Marie
Current Estimated Value
Home Financials for this Owner
Home Financials are based on the most recent Mortgage that was taken out on this home.
Original Mortgage
$518,000
Outstanding Balance
$436,111
Interest Rate
3.94%
Mortgage Type
New Conventional
Estimated Equity
$1,500,496
Purchase Details
Closed on
Oct 14, 2016
Sold by
Mawson Christopher and Murphy Kristin Michelle
Bought by
Mawson Christopher and Murphy Kristin Michelle
Home Financials for this Owner
Home Financials are based on the most recent Mortgage that was taken out on this home.
Original Mortgage
$360,000
Interest Rate
3.44%
Mortgage Type
New Conventional
Purchase Details
Closed on
Jul 15, 2016
Sold by
Mawson Christopher
Bought by
Mawson Christopher and Murphy Kristin Michelle
Create a Home Valuation Report for This Property
The Home Valuation Report is an in-depth analysis detailing your home's value as well as a comparison with similar homes in the area
Home Values in the Area
Average Home Value in this Area
Purchase History
| Date | Buyer | Sale Price | Title Company |
|---|---|---|---|
| Stauffer Zachary Jakob | $1,418,000 | Old Republic Title Company | |
| Mawson Christopher | -- | First American Title | |
| Mawson Christopher | -- | None Available |
Source: Public Records
Mortgage History
| Date | Status | Borrower | Loan Amount |
|---|---|---|---|
| Open | Stauffer Zachary Jakob | $518,000 | |
| Previous Owner | Mawson Christopher | $360,000 |
Source: Public Records
Tax History
| Year | Tax Paid | Tax Assessment Tax Assessment Total Assessment is a certain percentage of the fair market value that is determined by local assessors to be the total taxable value of land and additions on the property. | Land | Improvement |
|---|---|---|---|---|
| 2025 | $22,981 | $1,613,414 | $512,014 | $1,101,400 |
| 2024 | $22,981 | $1,581,779 | $501,975 | $1,079,804 |
| 2023 | $22,475 | $1,550,766 | $492,133 | $1,058,633 |
| 2022 | $22,071 | $1,520,364 | $482,485 | $1,037,879 |
| 2021 | $22,164 | $1,490,558 | $473,026 | $1,017,532 |
| 2020 | $21,137 | $1,475,287 | $468,180 | $1,007,107 |
| 2019 | $20,486 | $1,446,360 | $459,000 | $987,360 |
| 2018 | $21,166 | $1,418,000 | $450,000 | $968,000 |
| 2017 | $7,712 | $346,335 | $103,900 | $242,435 |
| 2016 | $6,433 | $339,546 | $101,864 | $237,682 |
| 2015 | $6,327 | $334,447 | $100,334 | $234,113 |
| 2014 | $6,240 | $327,897 | $98,369 | $229,528 |
Source: Public Records
Map
Nearby Homes
- 2401 Carleton St
- 2543 Chilton Way
- 2702 Dana St
- 2535 Chilton Way
- 2415 Blake St
- 2319 Ward St
- 2550 Dana St Unit 2F
- 2601 College Ave Unit 203
- 2601 College Ave Unit 208
- 2509 Dwight Way
- 2611 Piedmont Ave Unit 4
- 2243 Ashby Ave
- 2477 Prince St
- 2951 Linden Ave
- 2123 Oregon St
- 2907 Channing Way
- 6446 Colby St
- 2 Panoramic Way Unit 105
- 2 Panoramic Way Unit 304
- 2110 Ashby Ave
- 2515 Derby St
- 2509 Derby St
- 2517 Derby St
- 2519 Derby St
- 2505 Derby St
- 2636 Hillegass Ave
- 2639 Regent St
- 2646 Hillegass Ave
- 2647 Regent St
- 2632 Hillegass Ave Unit E
- 2632 Hillegass Ave Unit A
- 2632 Hillegass Ave Unit 4
- 2632 Hillegass Ave Unit 3
- 2632 Hillegass Ave Unit 1
- 2632 Hillegass Ave Unit 2
- 2626 Hillegass Ave Unit C
- 2626 Hillegass Ave Unit B
- 2626 Hillegass Ave Unit A
- 2626 Hillegass Ave Unit D
- 2633 Regent St
Your Personal Tour Guide
Ask me questions while you tour the home.