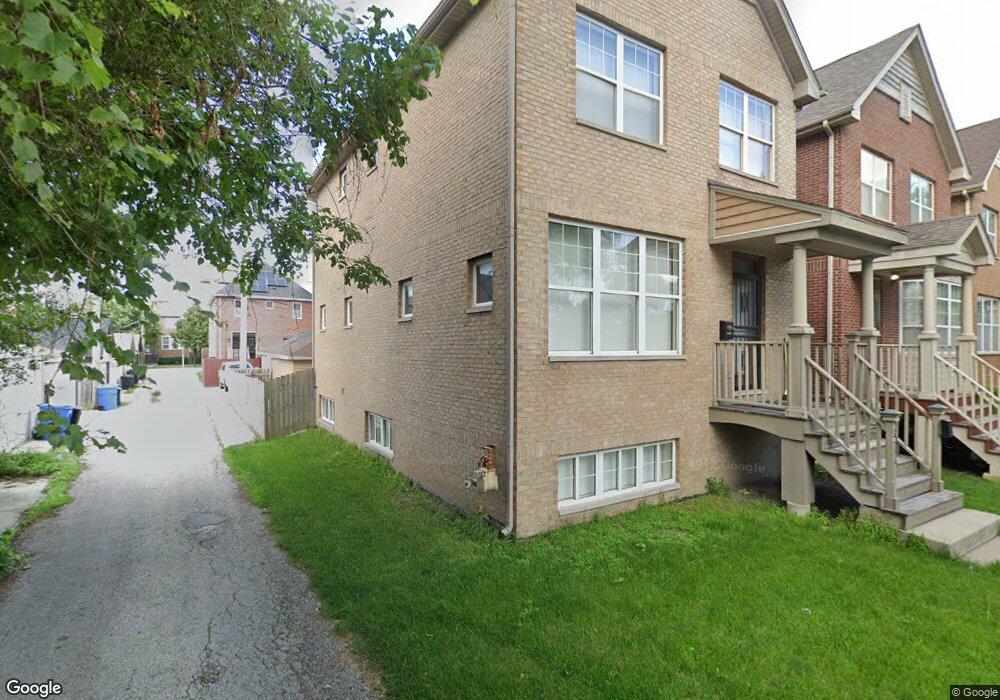
2511 S Stark St Chicago, IL 60608
Bridgeport NeighborhoodEstimated Value: $600,916 - $708,000
5
Beds
4
Baths
2,122
Sq Ft
$307/Sq Ft
Est. Value
About This Home
This home is located at 2511 S Stark St, Chicago, IL 60608 and is currently estimated at $651,979, approximately $307 per square foot. 2511 S Stark St is a home located in Cook County with nearby schools including Holden Elementary School, St Barbara Elementary School, and St Therese School West.
Ownership History
Date
Name
Owned For
Owner Type
Purchase Details
Closed on
Dec 28, 2006
Sold by
Bridgeport Landings Llc
Bought by
Dea Howard and Dea Sandy
Current Estimated Value
Home Financials for this Owner
Home Financials are based on the most recent Mortgage that was taken out on this home.
Original Mortgage
$300,000
Interest Rate
6.24%
Mortgage Type
Purchase Money Mortgage
Create a Home Valuation Report for This Property
The Home Valuation Report is an in-depth analysis detailing your home's value as well as a comparison with similar homes in the area
Home Values in the Area
Average Home Value in this Area
Purchase History
| Date | Buyer | Sale Price | Title Company |
|---|---|---|---|
| Dea Howard | $432,000 | -- |
Source: Public Records
Mortgage History
| Date | Status | Borrower | Loan Amount |
|---|---|---|---|
| Previous Owner | Dea Howard | $300,000 |
Source: Public Records
Tax History Compared to Growth
Tax History
| Year | Tax Paid | Tax Assessment Tax Assessment Total Assessment is a certain percentage of the fair market value that is determined by local assessors to be the total taxable value of land and additions on the property. | Land | Improvement |
|---|---|---|---|---|
| 2024 | $8,873 | $52,901 | $15,192 | $37,709 |
| 2023 | $8,628 | $45,369 | $12,276 | $33,093 |
| 2022 | $8,628 | $45,369 | $12,276 | $33,093 |
| 2021 | $8,825 | $47,218 | $12,276 | $34,942 |
| 2020 | $6,758 | $33,440 | $9,820 | $23,620 |
| 2019 | $6,776 | $37,156 | $9,820 | $27,336 |
| 2018 | $7,703 | $42,430 | $9,820 | $32,610 |
| 2017 | $6,294 | $32,612 | $7,672 | $24,940 |
| 2016 | $6,032 | $32,612 | $7,672 | $24,940 |
| 2015 | $6,335 | $37,195 | $7,672 | $29,523 |
| 2014 | $5,137 | $30,258 | $6,138 | $24,120 |
| 2013 | $5,025 | $30,258 | $6,138 | $24,120 |
Source: Public Records
Map
Nearby Homes
- 2520 S Stark St
- 2517 S Mary St
- 2725 S Quinn St
- 2713 S Crowell St
- 2819 S Quinn St
- 2837 S Farrell St
- 2879 S Throop St
- 2948 S Lyman St
- 2935 S Throop St
- 2850 S Poplar Ave
- 2812 S Quinn St
- 2922 S Keeley St
- 2947 S Farrell St
- 2951 S Farrell St
- 2807 S Halsted St Unit 201
- 2807 S Halsted St Unit 205
- 2807 S Halsted St Unit 204
- 2859 S Hillock Ave
- 2567 S Emerald Ave
- 2828 S Emerald Ave
- 2513 S Stark St
- 2515 S Stark St
- 2519 S Stark St
- 2535 S Hillock Ave
- 2521 S Stark St
- 2512 S Stark St
- 2533 S Hillock Ave
- 2531 S Hillock Ave
- 2536 S Stark St
- 2529 S Hillock Ave
- 2525 S Hillock Ave
- 2512 S Mary St
- 2512 S Mary St
- 2516 S Mary St
- 2525 S Stark St
- 2518 S Mary St
- 2534 S Stark St
- 2532 S Stark St
- 2523 S Hillock Ave
- 2543 S Hillock Ave