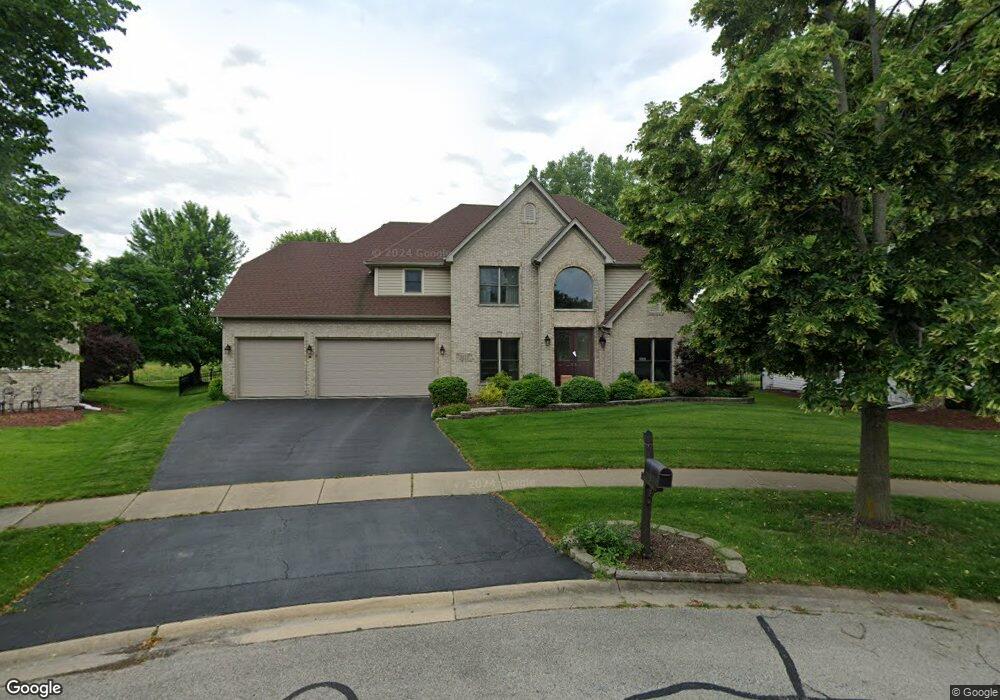
2512 Hoddam Ct Unit 4 Naperville, IL 60564
Harmony Grove NeighborhoodEstimated Value: $711,000 - $770,000
--
Bed
1
Bath
2,960
Sq Ft
$250/Sq Ft
Est. Value
About This Home
This home is located at 2512 Hoddam Ct Unit 4, Naperville, IL 60564 and is currently estimated at $739,740, approximately $249 per square foot. 2512 Hoddam Ct Unit 4 is a home located in Will County with nearby schools including Oliver Julian Kendall Elementary School, Ellsworth Elementary School, and Clifford Crone Middle School.
Ownership History
Date
Name
Owned For
Owner Type
Purchase Details
Closed on
Mar 14, 2022
Sold by
Venia Joseph J and Venia Margaret A
Bought by
Krebs Bryon D and Zhang Yi
Current Estimated Value
Home Financials for this Owner
Home Financials are based on the most recent Mortgage that was taken out on this home.
Original Mortgage
$454,400
Outstanding Balance
$418,180
Interest Rate
3%
Mortgage Type
New Conventional
Estimated Equity
$321,560
Purchase Details
Closed on
Aug 8, 2002
Sold by
Mcconnaughey John E and Mcconnaughey Tina M
Bought by
Venia Joseph J and Venia Margaret A
Home Financials for this Owner
Home Financials are based on the most recent Mortgage that was taken out on this home.
Original Mortgage
$210,000
Interest Rate
6.56%
Purchase Details
Closed on
Oct 8, 1998
Sold by
Maf Developments Inc
Bought by
Philip R Thompson Builders Inc
Home Financials for this Owner
Home Financials are based on the most recent Mortgage that was taken out on this home.
Original Mortgage
$65,150
Interest Rate
6.9%
Mortgage Type
Construction
Create a Home Valuation Report for This Property
The Home Valuation Report is an in-depth analysis detailing your home's value as well as a comparison with similar homes in the area
Home Values in the Area
Average Home Value in this Area
Purchase History
| Date | Buyer | Sale Price | Title Company |
|---|---|---|---|
| Krebs Bryon D | $568,000 | Chicago Title | |
| Venia Joseph J | $425,000 | -- | |
| Philip R Thompson Builders Inc | $87,000 | Chicago Title Insurance Co |
Source: Public Records
Mortgage History
| Date | Status | Borrower | Loan Amount |
|---|---|---|---|
| Open | Krebs Bryon D | $454,400 | |
| Previous Owner | Venia Joseph J | $210,000 | |
| Previous Owner | Philip R Thompson Builders Inc | $65,150 |
Source: Public Records
Tax History Compared to Growth
Tax History
| Year | Tax Paid | Tax Assessment Tax Assessment Total Assessment is a certain percentage of the fair market value that is determined by local assessors to be the total taxable value of land and additions on the property. | Land | Improvement |
|---|---|---|---|---|
| 2024 | $13,172 | $209,105 | $43,748 | $165,357 |
| 2023 | $13,172 | $184,722 | $38,647 | $146,075 |
| 2022 | $11,476 | $169,390 | $36,560 | $132,830 |
| 2021 | $10,950 | $161,324 | $34,819 | $126,505 |
| 2020 | $10,736 | $158,768 | $34,267 | $124,501 |
| 2019 | $10,908 | $154,293 | $33,301 | $120,992 |
| 2018 | $10,258 | $142,935 | $32,568 | $110,367 |
| 2017 | $11,561 | $158,517 | $31,727 | $126,790 |
| 2016 | $11,540 | $155,105 | $31,044 | $124,061 |
| 2015 | $11,439 | $149,139 | $29,850 | $119,289 |
| 2014 | $11,439 | $145,065 | $29,850 | $115,215 |
| 2013 | $11,439 | $145,065 | $29,850 | $115,215 |
Source: Public Records
Map
Nearby Homes
- 2711 Wait Rd
- 2255 Wendt Cir
- 1736 Robert Ln
- 29W316 Andermann Dr
- 26106 W Sherwood Cir
- 23234 W Allagash Dr
- 1804 Princess Cir
- 11110 Highland Dr
- 24024 W Champion Dr
- 11319 Maplewood Dr
- 3707 Junebreeze Ln
- 2543 Mallet Ct
- 2539 Mallet Ct
- 2547 Mallet Ct
- 2519 Mallet Ct
- 2419 Lawlor Ln
- 2423 Lawlor Ln
- 2427 Lawlor Ln
- 2611 Lawlor Ln
- 2607 Lawlor Ln
- 2508 Hoddam Ct
- 2520 Hoddam Ct Unit 4
- 2504 Hoddam Ct
- 2503 Hoddam Ct
- 2511 Hoddam Ct
- 2524 Hoddam Ct
- 2515 Hoddam Ct
- 2519 Hoddam Ct
- 2528 Hoddam Ct
- 4607 Fesseneva Ct
- 4604 Fesseneva Ct
- 2508 Freeland Ct
- 2523 Hoddam Ct
- 2512 Freeland Ct
- 2532 Hoddam Ct
- 2516 Freeland Ct
- 2516 Freeland Ct
- 4612 Chokeberry Dr
- 2504 Freeland Ct Unit 4
- 2520 Freeland Ct