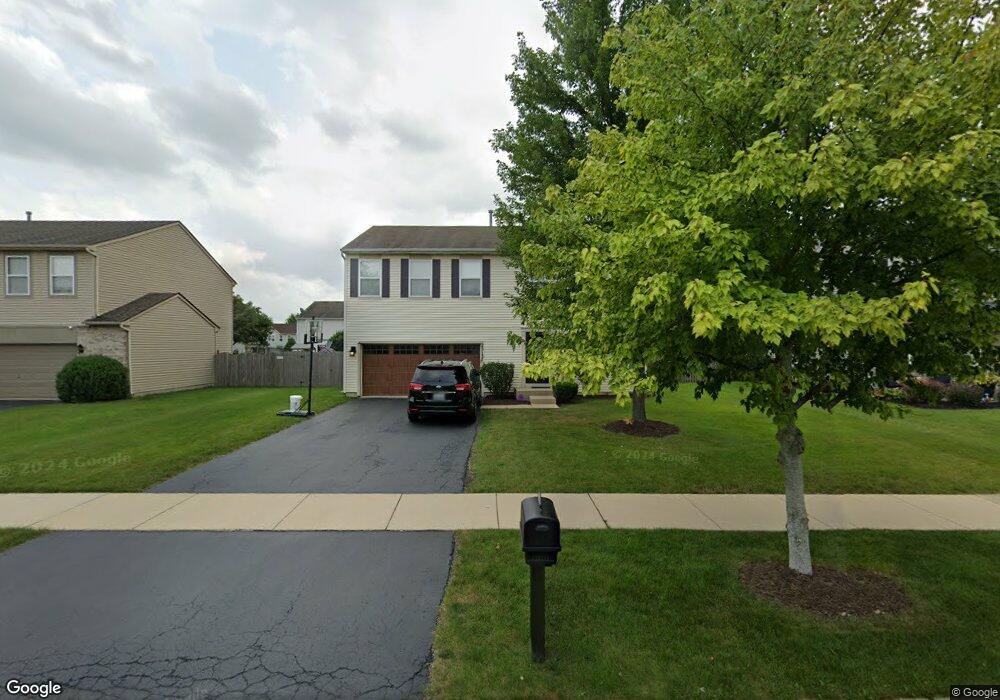
25137 Declaration Dr Plainfield, IL 60544
West Plainfield NeighborhoodEstimated Value: $378,000 - $449,000
4
Beds
3
Baths
2,224
Sq Ft
$191/Sq Ft
Est. Value
About This Home
This home is located at 25137 Declaration Dr, Plainfield, IL 60544 and is currently estimated at $425,531, approximately $191 per square foot. 25137 Declaration Dr is a home located in Will County with nearby schools including Lincoln Elementary School, Richard Ira Jones Middle School, and Plainfield North High School.
Ownership History
Date
Name
Owned For
Owner Type
Purchase Details
Closed on
Mar 31, 2017
Sold by
U S Bank National Association
Bought by
Guarino Charles and Guarino Melissa
Current Estimated Value
Home Financials for this Owner
Home Financials are based on the most recent Mortgage that was taken out on this home.
Original Mortgage
$240,562
Outstanding Balance
$200,403
Interest Rate
4.25%
Mortgage Type
FHA
Estimated Equity
$225,129
Purchase Details
Closed on
Jan 11, 2017
Sold by
Rosales Mauel J and Rosles Lucila
Bought by
U S Bank National Association
Purchase Details
Closed on
Jan 18, 2006
Sold by
Drh Cambridge Homes Inc
Bought by
Rosales Manuel J and Rosales Lucila
Home Financials for this Owner
Home Financials are based on the most recent Mortgage that was taken out on this home.
Original Mortgage
$199,826
Interest Rate
8.59%
Mortgage Type
Fannie Mae Freddie Mac
Create a Home Valuation Report for This Property
The Home Valuation Report is an in-depth analysis detailing your home's value as well as a comparison with similar homes in the area
Home Values in the Area
Average Home Value in this Area
Purchase History
| Date | Buyer | Sale Price | Title Company |
|---|---|---|---|
| Guarino Charles | $245,000 | Chicago Title | |
| U S Bank National Association | -- | Attorney | |
| Rosales Manuel J | $235,500 | First American Title |
Source: Public Records
Mortgage History
| Date | Status | Borrower | Loan Amount |
|---|---|---|---|
| Open | Guarino Charles | $240,562 | |
| Previous Owner | Rosales Manuel J | $199,826 |
Source: Public Records
Tax History
| Year | Tax Paid | Tax Assessment Tax Assessment Total Assessment is a certain percentage of the fair market value that is determined by local assessors to be the total taxable value of land and additions on the property. | Land | Improvement |
|---|---|---|---|---|
| 2024 | $7,898 | $115,126 | $30,220 | $84,906 |
| 2023 | $7,898 | $103,979 | $27,294 | $76,685 |
| 2022 | $7,546 | $93,388 | $24,514 | $68,874 |
| 2021 | $6,691 | $87,278 | $22,910 | $64,368 |
| 2020 | $6,593 | $84,802 | $22,260 | $62,542 |
| 2019 | $6,353 | $80,802 | $21,210 | $59,592 |
| 2018 | $6,587 | $81,985 | $19,730 | $62,255 |
| 2017 | $6,377 | $77,910 | $18,749 | $59,161 |
| 2016 | $6,213 | $74,306 | $17,882 | $56,424 |
| 2015 | $5,860 | $69,607 | $16,751 | $52,856 |
| 2014 | $5,860 | $67,150 | $16,160 | $50,990 |
| 2013 | $5,860 | $67,150 | $16,160 | $50,990 |
Source: Public Records
Map
Nearby Homes
- 25138 Presidential Ave
- 14450 Independence Dr
- 14345 S Charlton Place
- 14343 S Charlton Place
- 14341 S Charlton Place
- 25439 W Alabaster Cir
- 25445 W Alabaster Cir
- 14561 S Greenbriar Dr
- 14565 S Greenbriar Dr
- 14609 S Greenbriar Dr
- 25504 W Alabaster Cir
- 14615 S Greenbriar Dr
- 25454 W Emory Ln
- 25506 W Alabaster Cir
- 14621 S Greenbriar Dr
- 14722 Colonial Pkwy Unit 3
- 25500 W Sandalwood Ln
- 25500 W Emory Ln
- 14627 S Greenbriar Dr
- 25502 W Emory Ln
- 25131 Declaration Dr
- 25143 Declaration Dr
- 25144 Presidential Ave Unit 6
- 25125 Declaration Dr
- 25205 Declaration Dr
- 25206 Presidential Ave Unit 6
- 25136 Declaration Dr
- 25132 Presidential Ave Unit 6
- 25130 Declaration Dr
- 25142 Declaration Dr
- 25211 Declaration Dr
- 25119 Declaration Dr
- 25212 Presidential Ave
- 25124 Declaration Dr
- 25204 Declaration Dr
- 25126 Presidential Ave
- 25113 Declaration Dr
- 25118 Declaration Dr
- 25217 Declaration Dr
- 25210 Declaration Dr
Your Personal Tour Guide
Ask me questions while you tour the home.