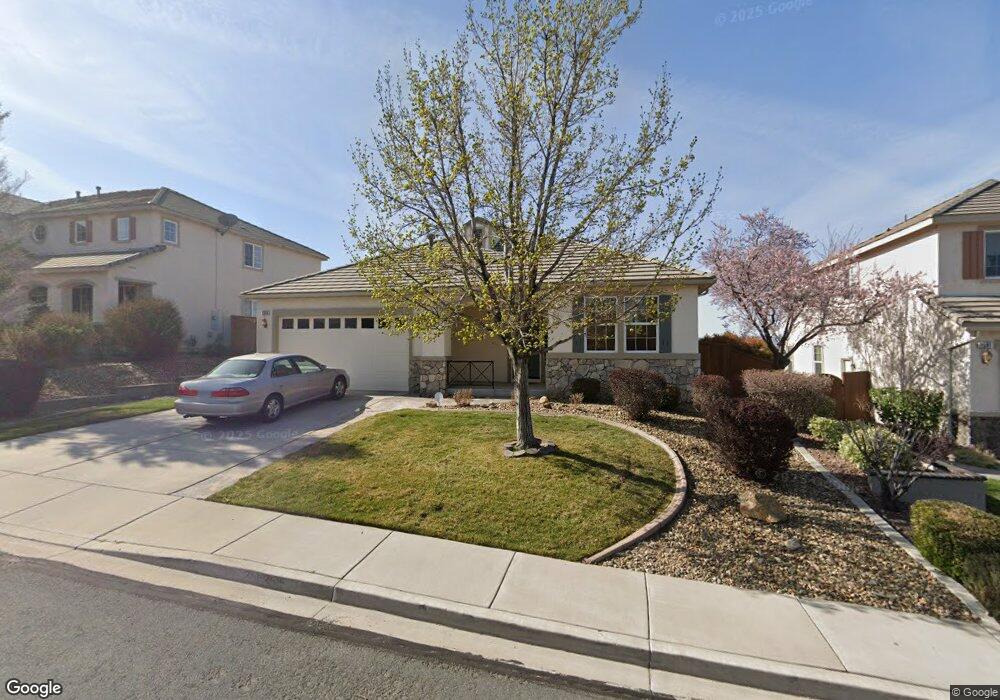
2515 Anqua Dr Sparks, NV 89434
D'Andrea NeighborhoodEstimated Value: $612,000 - $656,000
3
Beds
3
Baths
2,144
Sq Ft
$297/Sq Ft
Est. Value
About This Home
This home is located at 2515 Anqua Dr, Sparks, NV 89434 and is currently estimated at $637,048, approximately $297 per square foot. 2515 Anqua Dr is a home located in Washoe County with nearby schools including Marvin Moss Elementary School, Lou Mendive Middle School, and Edward C Reed High School.
Ownership History
Date
Name
Owned For
Owner Type
Purchase Details
Closed on
Jul 31, 2012
Sold by
Ward Melinda S
Bought by
Ward Melinda S and The Ward Living Trust
Current Estimated Value
Purchase Details
Closed on
Apr 18, 2012
Sold by
Ward Melinda S
Bought by
Ward Melinda S
Purchase Details
Closed on
Oct 1, 2008
Sold by
Ward Melinda S
Bought by
Ward Melinda S
Purchase Details
Closed on
Oct 5, 2006
Sold by
Mcdonald Mary
Bought by
Mcdonald Robert R
Home Financials for this Owner
Home Financials are based on the most recent Mortgage that was taken out on this home.
Original Mortgage
$360,000
Outstanding Balance
$211,116
Interest Rate
6.43%
Mortgage Type
Unknown
Estimated Equity
$425,932
Purchase Details
Closed on
Sep 29, 2006
Sold by
Mcdonald Robert R
Bought by
Ward Melinda S
Home Financials for this Owner
Home Financials are based on the most recent Mortgage that was taken out on this home.
Original Mortgage
$360,000
Outstanding Balance
$211,116
Interest Rate
6.43%
Mortgage Type
Unknown
Estimated Equity
$425,932
Purchase Details
Closed on
Jul 8, 2004
Sold by
Sidwell William J and Sidwell Cheryl L
Bought by
Mcdonald Robert R
Home Financials for this Owner
Home Financials are based on the most recent Mortgage that was taken out on this home.
Original Mortgage
$328,000
Interest Rate
6.31%
Mortgage Type
Unknown
Purchase Details
Closed on
Apr 15, 2004
Sold by
Sidwell William J
Bought by
Sidwell William J and Sidwell Cheryl L
Purchase Details
Closed on
Feb 12, 2004
Sold by
Sidwell Cheryl L
Bought by
Sidwell William J
Home Financials for this Owner
Home Financials are based on the most recent Mortgage that was taken out on this home.
Original Mortgage
$333,000
Interest Rate
5.82%
Mortgage Type
New Conventional
Purchase Details
Closed on
Jan 4, 2004
Sold by
Sidwell Christine J and Simpson Christine J
Bought by
Sidwell William J
Home Financials for this Owner
Home Financials are based on the most recent Mortgage that was taken out on this home.
Original Mortgage
$333,000
Interest Rate
5.82%
Mortgage Type
New Conventional
Purchase Details
Closed on
Dec 9, 2002
Sold by
Centex Homes
Bought by
Sidwell William J and Sidwell Christine J
Home Financials for this Owner
Home Financials are based on the most recent Mortgage that was taken out on this home.
Original Mortgage
$266,550
Interest Rate
6.06%
Create a Home Valuation Report for This Property
The Home Valuation Report is an in-depth analysis detailing your home's value as well as a comparison with similar homes in the area
Home Values in the Area
Average Home Value in this Area
Purchase History
| Date | Buyer | Sale Price | Title Company |
|---|---|---|---|
| Ward Melinda S | -- | None Available | |
| Ward Melinda S | -- | None Available | |
| Ward Melinda S | -- | None Available | |
| Mcdonald Robert R | -- | First American Title | |
| Ward Melinda S | $450,000 | First American Title | |
| Mcdonald Robert R | $410,000 | First Centennial Title Co | |
| Sidwell William J | -- | -- | |
| Sidwell William J | -- | Founders Title Company Of Nv | |
| Sidwell William J | -- | -- | |
| Sidwell William J | $333,220 | Stewart Title Northern Nevad |
Source: Public Records
Mortgage History
| Date | Status | Borrower | Loan Amount |
|---|---|---|---|
| Open | Ward Melinda S | $360,000 | |
| Previous Owner | Mcdonald Robert R | $328,000 | |
| Previous Owner | Sidwell William J | $333,000 | |
| Previous Owner | Sidwell William J | $266,550 | |
| Closed | Mcdonald Robert R | $82,000 |
Source: Public Records
Tax History
| Year | Tax Paid | Tax Assessment Tax Assessment Total Assessment is a certain percentage of the fair market value that is determined by local assessors to be the total taxable value of land and additions on the property. | Land | Improvement |
|---|---|---|---|---|
| 2026 | $2,872 | $166,166 | $66,483 | $99,684 |
| 2025 | $3,725 | $178,381 | $77,144 | $101,237 |
| 2024 | $3,725 | $176,727 | $74,431 | $102,296 |
| 2023 | $3,617 | $169,732 | $73,346 | $96,387 |
| 2022 | $3,512 | $137,623 | $57,451 | $80,172 |
| 2021 | $3,410 | $122,746 | $42,966 | $79,780 |
| 2020 | $3,309 | $127,347 | $47,415 | $79,932 |
| 2019 | $3,212 | $120,082 | $43,400 | $76,682 |
| 2018 | $3,079 | $108,783 | $34,774 | $74,009 |
| 2017 | $2,989 | $108,305 | $34,178 | $74,127 |
| 2016 | $2,914 | $103,478 | $27,776 | $75,702 |
| 2015 | $2,909 | $104,519 | $29,078 | $75,441 |
| 2014 | $2,825 | $89,200 | $27,179 | $62,021 |
| 2013 | -- | $75,668 | $22,188 | $53,480 |
Source: Public Records
Map
Nearby Homes
- 2600 Anqua Ct
- 2485 Firenze Dr
- 2199 Lucca Ln
- 1750 Corleone Dr
- 2854 Cintoia Dr
- 1759 Veneto Dr
- 1741 Medolla Dr
- 3375 Culpepper Dr
- 2152 Wabash Cir
- 2688 Laguna Way
- 2264 Fernwood Ct
- 3307 Vincinato Dr
- 0 Martini Rd Unit 260001673
- 3142 Jarbidge Way
- 2419 Tecumseh Way
- 2389 Tecumseh Way Unit 15
- 2381 Tecumseh Way Unit 18
- 2408 Tecumseh Way
- 2227 Valencia Way
- 1695 Atlantic Way
Your Personal Tour Guide
Ask me questions while you tour the home.