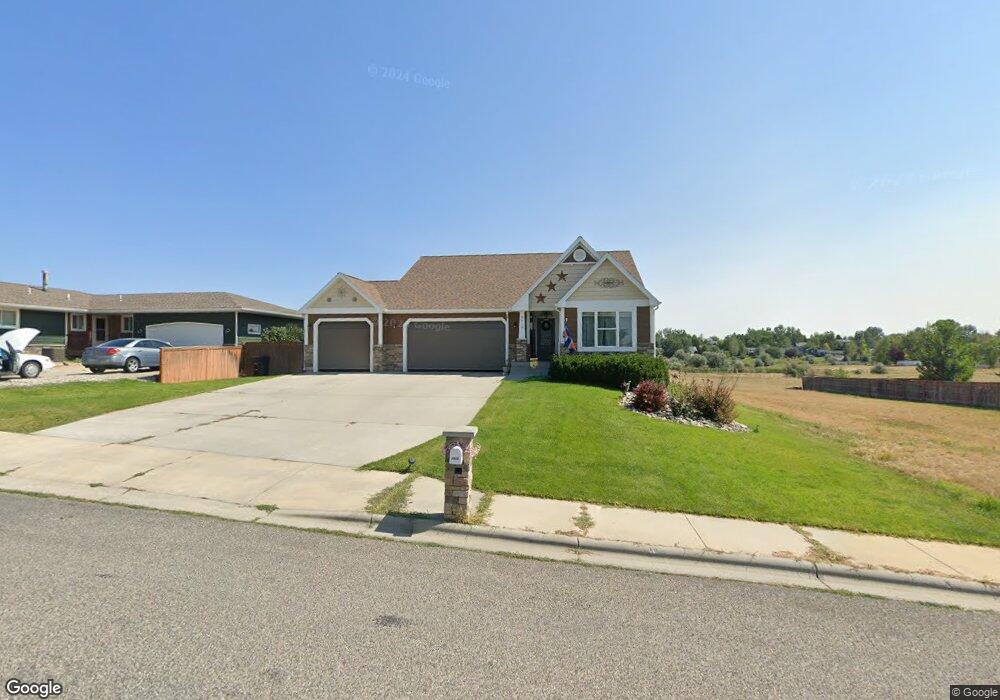
2515 Lake Heights Dr Billings, MT 59105
Billings Heights NeighborhoodEstimated Value: $530,441 - $568,000
6
Beds
3
Baths
3,348
Sq Ft
$163/Sq Ft
Est. Value
About This Home
This home is located at 2515 Lake Heights Dr, Billings, MT 59105 and is currently estimated at $544,860, approximately $162 per square foot. 2515 Lake Heights Dr is a home located in Yellowstone County with nearby schools including Independent Elementary School, Castle Rock Junior High School, and Skyview High School.
Ownership History
Date
Name
Owned For
Owner Type
Purchase Details
Closed on
May 31, 2023
Sold by
Sawyer David and Conway Amy K
Bought by
Anderson Nicholas W and Anderson Lindi J
Current Estimated Value
Home Financials for this Owner
Home Financials are based on the most recent Mortgage that was taken out on this home.
Original Mortgage
$352,000
Outstanding Balance
$342,588
Interest Rate
6.39%
Mortgage Type
New Conventional
Estimated Equity
$202,273
Purchase Details
Closed on
Jul 2, 2020
Sold by
Jones Laighton D and Jones Katie M
Bought by
Sawyer David and Conway Amy K
Purchase Details
Closed on
Oct 9, 2009
Sold by
Davis Timothy E and Davis Kerry L
Bought by
Jones Laighton D and Jones Katie M
Home Financials for this Owner
Home Financials are based on the most recent Mortgage that was taken out on this home.
Original Mortgage
$288,982
Interest Rate
5.14%
Mortgage Type
VA
Purchase Details
Closed on
Apr 2, 2008
Sold by
Susan B Lovely Inc
Bought by
Davis Timothy E and Davis Kerry L
Create a Home Valuation Report for This Property
The Home Valuation Report is an in-depth analysis detailing your home's value as well as a comparison with similar homes in the area
Home Values in the Area
Average Home Value in this Area
Purchase History
| Date | Buyer | Sale Price | Title Company |
|---|---|---|---|
| Anderson Nicholas W | -- | First Montana Title Company | |
| Sawyer David | -- | Chicago Title | |
| Jones Laighton D | -- | None Available | |
| Davis Timothy E | -- | None Available |
Source: Public Records
Mortgage History
| Date | Status | Borrower | Loan Amount |
|---|---|---|---|
| Open | Anderson Nicholas W | $352,000 | |
| Previous Owner | Jones Laighton D | $288,982 |
Source: Public Records
Tax History Compared to Growth
Tax History
| Year | Tax Paid | Tax Assessment Tax Assessment Total Assessment is a certain percentage of the fair market value that is determined by local assessors to be the total taxable value of land and additions on the property. | Land | Improvement |
|---|---|---|---|---|
| 2025 | $4,216 | $544,300 | $74,847 | $469,453 |
| 2024 | $4,216 | $460,200 | $66,164 | $394,036 |
| 2023 | $4,292 | $459,700 | $66,164 | $393,536 |
| 2022 | $3,924 | $368,400 | $0 | $0 |
| 2021 | $3,720 | $368,400 | $0 | $0 |
| 2020 | $3,380 | $320,100 | $0 | $0 |
| 2019 | $3,288 | $320,100 | $0 | $0 |
| 2018 | $3,432 | $313,200 | $0 | $0 |
| 2017 | $3,434 | $313,200 | $0 | $0 |
| 2016 | $3,120 | $301,000 | $0 | $0 |
| 2015 | $2,969 | $301,000 | $0 | $0 |
| 2014 | $2,639 | $136,104 | $0 | $0 |
Source: Public Records
Map
Nearby Homes
- 2435 Lake Heights Dr
- 419 Montecito Ave
- 425 Montecito Ave
- 418 Montecito Ave
- 443 Montecito Ave
- 482 Montecito Ave
- 603 Chino Cir
- 515 Montecito Ave
- 584 Chino Cir
- Lot 1, Block 1 Greenbriar Rd
- 0 Winged Foot Dr
- 2164 Greenbriar Rd
- 00 Winged Foot Drive Lot 10
- 00
- 0 Greenbriar Rd
- 2515 Constellation Trail
- 2043 Cypress Point
- 2500 Keel Dr
- 2115 Saint Andrews Dr
- 2253 Gleneagles Blvd
- 2521 Lake Heights Dr
- TBD Lake Heights Dr
- 2527 Lake Heights Dr
- 2503 Lake Heights Dr
- 000 Lake Heights Dr
- 0 Lake Heights Dr
- 2533 Lake Heights Dr
- 2508 Lake Heights Dr
- 2441 Lake Heights Dr
- 2520 Lake Heights Dr
- 2514 Lake Heights Dr
- 2526 Lake Heights Dr
- 2502 Lake Heights Dr
- 2539 Lake Heights Dr
- 2532 Lake Heights Dr
- 2545 Lake Heights Dr
- 2434 Lake Heights Dr
- 2440 Lake Heights Dr
- 2567 Lake Heights Dr
- 2563 Lake Heights Dr