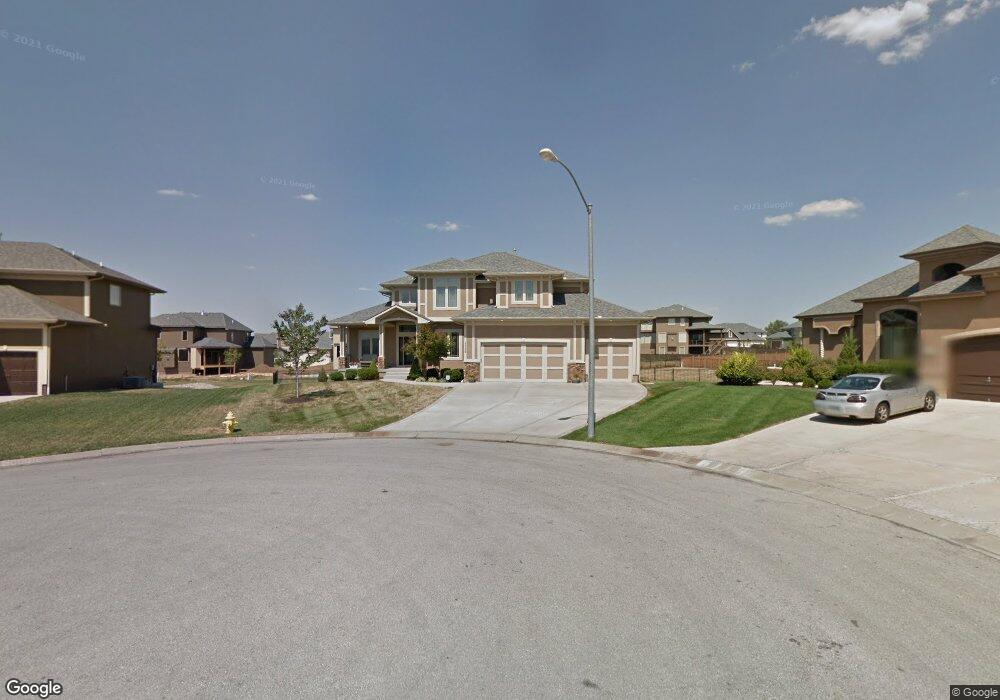
2516 NE Bitter Creek Ct Lees Summit, MO 64086
Estimated Value: $663,284 - $686,000
4
Beds
6
Baths
3,362
Sq Ft
$200/Sq Ft
Est. Value
About This Home
This home is located at 2516 NE Bitter Creek Ct, Lees Summit, MO 64086 and is currently estimated at $671,761, approximately $199 per square foot. 2516 NE Bitter Creek Ct is a home located in Jackson County with nearby schools including Richardson Elementary School, Bernard C. Campbell Middle School, and Lee's Summit North High School.
Ownership History
Date
Name
Owned For
Owner Type
Purchase Details
Closed on
Sep 22, 2023
Sold by
Myers Ryan D and Myers Sara A
Bought by
Myers Ryan D and Myers Sara A
Current Estimated Value
Purchase Details
Closed on
Jul 29, 2008
Sold by
Summit Custom Homes Llc
Bought by
Myers Ryan D and Myers Sara A
Home Financials for this Owner
Home Financials are based on the most recent Mortgage that was taken out on this home.
Original Mortgage
$399,879
Interest Rate
6.4%
Mortgage Type
Purchase Money Mortgage
Purchase Details
Closed on
Jul 25, 2007
Sold by
Richardson Ranch Llc
Bought by
Summit Custom Homes Llc
Home Financials for this Owner
Home Financials are based on the most recent Mortgage that was taken out on this home.
Original Mortgage
$361,600
Interest Rate
6.71%
Mortgage Type
Construction
Create a Home Valuation Report for This Property
The Home Valuation Report is an in-depth analysis detailing your home's value as well as a comparison with similar homes in the area
Home Values in the Area
Average Home Value in this Area
Purchase History
| Date | Buyer | Sale Price | Title Company |
|---|---|---|---|
| Myers Ryan D | -- | None Listed On Document | |
| Myers Ryan D | -- | Kansas City Title | |
| Summit Custom Homes Llc | -- | Stewart Title Of Kansas City |
Source: Public Records
Mortgage History
| Date | Status | Borrower | Loan Amount |
|---|---|---|---|
| Previous Owner | Myers Ryan D | $399,879 | |
| Previous Owner | Summit Custom Homes Llc | $361,600 |
Source: Public Records
Tax History Compared to Growth
Tax History
| Year | Tax Paid | Tax Assessment Tax Assessment Total Assessment is a certain percentage of the fair market value that is determined by local assessors to be the total taxable value of land and additions on the property. | Land | Improvement |
|---|---|---|---|---|
| 2025 | $7,867 | $125,288 | $16,070 | $109,218 |
| 2024 | $7,809 | $108,946 | $11,932 | $97,014 |
| 2023 | $7,809 | $108,946 | $6,333 | $102,613 |
| 2022 | $8,604 | $106,590 | $14,260 | $92,330 |
| 2021 | $8,783 | $106,590 | $14,260 | $92,330 |
| 2020 | $8,294 | $99,680 | $14,260 | $85,420 |
| 2019 | $8,067 | $99,680 | $14,260 | $85,420 |
| 2018 | $1,735,403 | $86,601 | $10,796 | $75,805 |
| 2017 | $7,553 | $86,601 | $10,796 | $75,805 |
| 2016 | $7,318 | $83,049 | $12,103 | $70,946 |
| 2014 | $6,831 | $76,000 | $12,103 | $63,897 |
Source: Public Records
Map
Nearby Homes
- 416 NE Bitter Creek Rd
- 2312 NE Sweet Water Dr
- 2504 NE Woodland Oak Cir
- 2313 NE Old Paint Rd
- 514 NE Viewpark Dr
- 2504 NE Dale Hunter Trail
- 304 SE Wood Ln
- 2505 NE Dale Hunter Trail
- 214 SE Windsboro Ct
- 201 SE Somerset Dr
- 354 SE Wood Ln
- 415 NE Corsicana St
- 321 SE Golden Ln
- 406 NE Keystone Dr
- 1032 NE Bristol Dr
- 258 SE Topaz Cir
- 2112 SE 3rd St
- 2000 NE Dill Dr
- 23808 E Langsford Rd
- 1016 NE Remington Ct
- 2520 NE Bitter Creek Ct
- 2512 NE Bitter Creek Ct
- 2509 NE Angel Fish Place
- 2513 NE Angel Fish Place
- 516 NE Spring Creek Place
- 2505 NE Angel Fish Place
- 2504 NE Bitter Creek Ct
- 2517 NE Angel Fish Place
- 2521 NE Bitter Creek Ct
- 508 NE Spring Creek Place
- 2517 NE Bitter Creek Ct
- 2513 NE Bitter Creek Ct
- 2501 NE Angel Fish Place
- 2500 NE Bitter Creek Ct
- 2509 NE Bitter Creek Ct
- 504 NE Spring Creek Place
- 2508 NE Angel Fish Place
- 2505 NE Bitter Creek Ct
- 2504 NE Spring Creek Dr
- 2504 NE Angel Fish Place