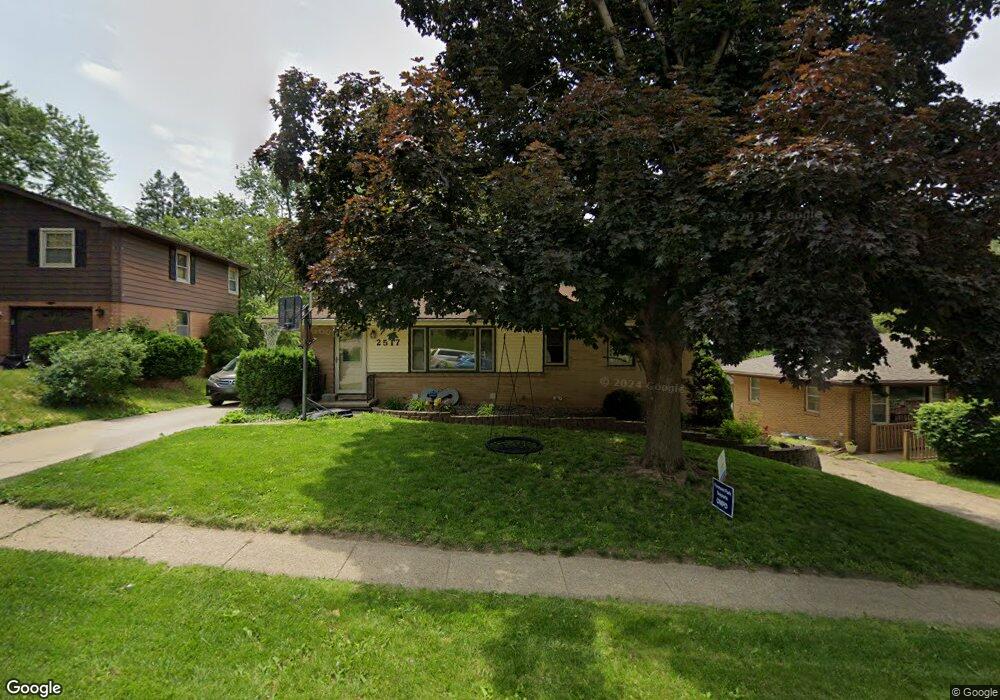
2517 Boyd St Des Moines, IA 50317
Fairmont Park NeighborhoodEstimated Value: $233,000 - $260,000
3
Beds
2
Baths
1,000
Sq Ft
$244/Sq Ft
Est. Value
About This Home
This home is located at 2517 Boyd St, Des Moines, IA 50317 and is currently estimated at $243,721, approximately $243 per square foot. 2517 Boyd St is a home located in Polk County with nearby schools including Garton Elementary School, Goodrell Middle School, and North High School.
Ownership History
Date
Name
Owned For
Owner Type
Purchase Details
Closed on
Mar 16, 2013
Sold by
Hammel Lynn K and Hammel Judy L
Bought by
Hammel Lynn K and Hammel Judy L
Current Estimated Value
Home Financials for this Owner
Home Financials are based on the most recent Mortgage that was taken out on this home.
Original Mortgage
$104,000
Outstanding Balance
$73,123
Interest Rate
3.46%
Mortgage Type
New Conventional
Estimated Equity
$170,598
Purchase Details
Closed on
Jan 30, 2005
Sold by
Schmidt Steven J and Schmidt Michelle L
Bought by
Hammel Lynn K
Home Financials for this Owner
Home Financials are based on the most recent Mortgage that was taken out on this home.
Original Mortgage
$13,266
Interest Rate
5.78%
Mortgage Type
Future Advance Clause Open End Mortgage
Purchase Details
Closed on
Sep 27, 1998
Sold by
Hutchinson Craig S and Hutchinson Peggy M
Bought by
Schmidt Steven J and Schmidt Michelle L
Home Financials for this Owner
Home Financials are based on the most recent Mortgage that was taken out on this home.
Original Mortgage
$72,800
Interest Rate
6.98%
Create a Home Valuation Report for This Property
The Home Valuation Report is an in-depth analysis detailing your home's value as well as a comparison with similar homes in the area
Home Values in the Area
Average Home Value in this Area
Purchase History
| Date | Buyer | Sale Price | Title Company |
|---|---|---|---|
| Hammel Lynn K | -- | None Available | |
| Hammel Lynn K | $133,500 | -- | |
| Schmidt Steven J | $90,500 | -- |
Source: Public Records
Mortgage History
| Date | Status | Borrower | Loan Amount |
|---|---|---|---|
| Open | Hammel Lynn K | $104,000 | |
| Closed | Hammel Lynn K | $13,266 | |
| Closed | Hammel Lynn K | $107,200 | |
| Previous Owner | Schmidt Steven J | $72,800 |
Source: Public Records
Tax History Compared to Growth
Tax History
| Year | Tax Paid | Tax Assessment Tax Assessment Total Assessment is a certain percentage of the fair market value that is determined by local assessors to be the total taxable value of land and additions on the property. | Land | Improvement |
|---|---|---|---|---|
| 2025 | $3,478 | $219,900 | $40,400 | $179,500 |
| 2024 | $3,478 | $187,310 | $36,000 | $151,310 |
| 2023 | $3,508 | $198,700 | $36,000 | $162,700 |
| 2022 | $3,480 | $169,100 | $32,100 | $137,000 |
| 2021 | $3,352 | $169,100 | $32,100 | $137,000 |
| 2020 | $3,476 | $154,300 | $29,200 | $125,100 |
| 2019 | $3,090 | $154,300 | $29,200 | $125,100 |
| 2018 | $3,094 | $134,900 | $25,000 | $109,900 |
| 2017 | $3,178 | $125,000 | $25,000 | $100,000 |
| 2016 | $3,090 | $126,000 | $20,700 | $105,300 |
| 2015 | $3,090 | $126,000 | $20,700 | $105,300 |
| 2014 | $3,278 | $132,100 | $21,300 | $110,800 |
Source: Public Records
Map
Nearby Homes
- 2809 E 24th St
- 2560 E Sheridan Ave
- 2633 Grandview Ave
- 2407 E Tiffin Ave
- 2511 E Ovid Ave
- 3218 E 26th St
- 3315 E 25th St
- 2718 Richmond Ave
- 2719 E Tiffin Ave
- 2722 E Tiffin Ave
- 2680 Hull Ave
- 2817 Richmond Ave
- 2323 E 23rd St
- 2622 E 29th St
- 2324 E 23rd St
- 2322 Guthrie Ave
- 2216 Lay St
- 2704 Wedgewood Rd
- 2737 E Euclid Ave
- 2622 John Patterson Rd
- 2521 Boyd St
- 2511 Boyd St
- 2507 Boyd St
- 2529 Boyd St
- 2516 Grandview Ave
- 2520 Grandview Ave
- 2512 Grandview Ave
- 2528 Grandview Ave
- 2501 Boyd St
- 2518 Boyd St
- 2512 Boyd St
- 2522 Boyd St
- 2502 Grandview Ave
- 2528 Boyd St
- 2905 E 25th St
- 2539 Boyd St
- 2536 Boyd St
- 2826 E 25th St
- 2517 Grandview Ave
- 2511 Grandview Ave