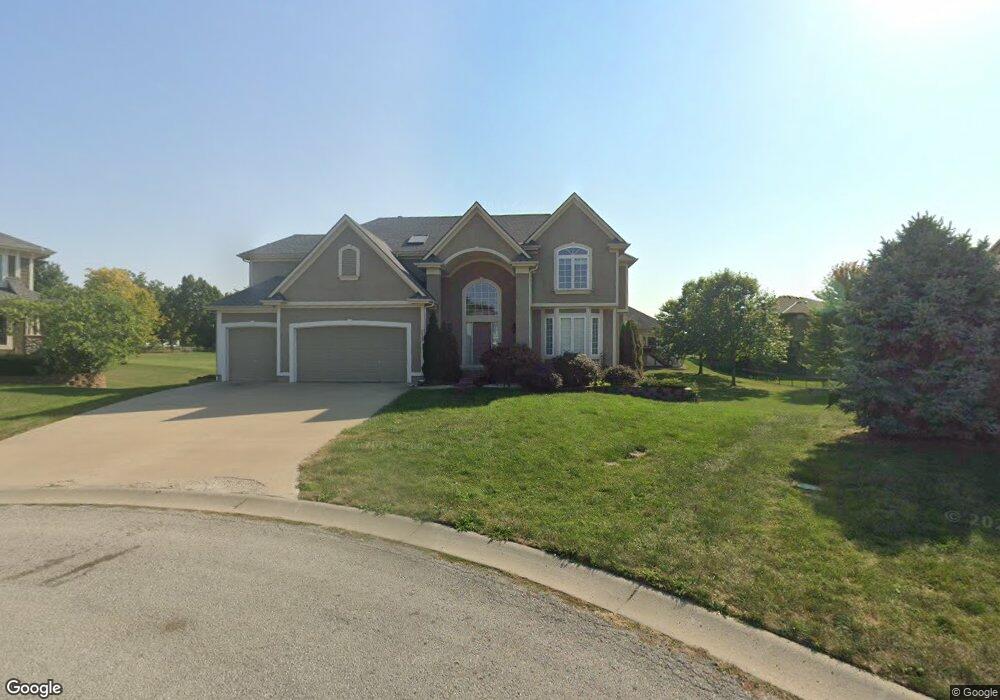
2517 NE Indian Pointe Lees Summit, MO 64086
Estimated Value: $547,000 - $636,000
4
Beds
4
Baths
2,671
Sq Ft
$223/Sq Ft
Est. Value
About This Home
This home is located at 2517 NE Indian Pointe, Lees Summit, MO 64086 and is currently estimated at $595,351, approximately $222 per square foot. 2517 NE Indian Pointe is a home located in Jackson County with nearby schools including Richardson Elementary School, Bernard C. Campbell Middle School, and Lee's Summit North High School.
Ownership History
Date
Name
Owned For
Owner Type
Purchase Details
Closed on
Nov 25, 2019
Sold by
Ho Dinh V and Ho Huyen Phiphi
Bought by
Lang Le Thi Kim and Bui Danny V
Current Estimated Value
Home Financials for this Owner
Home Financials are based on the most recent Mortgage that was taken out on this home.
Original Mortgage
$247,400
Outstanding Balance
$166,635
Interest Rate
3.6%
Mortgage Type
New Conventional
Estimated Equity
$428,716
Purchase Details
Closed on
Feb 9, 2009
Sold by
Krueger Gary H and Krueger Denise L
Bought by
Ho Hiep Dinh and Ho Dinh V
Purchase Details
Closed on
Mar 7, 2007
Sold by
Richardson Ranch Llc
Bought by
Krueger Gary H and Krueger Denise L
Home Financials for this Owner
Home Financials are based on the most recent Mortgage that was taken out on this home.
Original Mortgage
$296,000
Interest Rate
6.32%
Mortgage Type
Construction
Create a Home Valuation Report for This Property
The Home Valuation Report is an in-depth analysis detailing your home's value as well as a comparison with similar homes in the area
Home Values in the Area
Average Home Value in this Area
Purchase History
| Date | Buyer | Sale Price | Title Company |
|---|---|---|---|
| Lang Le Thi Kim | -- | Alpha | |
| Ho Hiep Dinh | -- | Kansas City Title | |
| Krueger Gary H | -- | Stewart Title Of Kansas City |
Source: Public Records
Mortgage History
| Date | Status | Borrower | Loan Amount |
|---|---|---|---|
| Open | Lang Le Thi Kim | $247,400 | |
| Previous Owner | Krueger Gary H | $296,000 |
Source: Public Records
Tax History Compared to Growth
Tax History
| Year | Tax Paid | Tax Assessment Tax Assessment Total Assessment is a certain percentage of the fair market value that is determined by local assessors to be the total taxable value of land and additions on the property. | Land | Improvement |
|---|---|---|---|---|
| 2025 | $7,349 | $117,051 | $15,599 | $101,452 |
| 2024 | $7,296 | $101,785 | $11,252 | $90,533 |
| 2023 | $7,296 | $101,785 | $6,487 | $95,298 |
| 2022 | $7,454 | $92,340 | $13,557 | $78,783 |
| 2021 | $7,608 | $92,340 | $13,557 | $78,783 |
| 2020 | $7,176 | $86,248 | $13,557 | $72,691 |
| 2019 | $6,980 | $86,248 | $13,557 | $72,691 |
| 2018 | $1,735,364 | $74,755 | $9,384 | $65,371 |
| 2017 | $6,360 | $74,755 | $9,384 | $65,371 |
| 2016 | $6,360 | $72,181 | $12,103 | $60,078 |
| 2014 | $5,977 | $66,500 | $12,103 | $54,397 |
Source: Public Records
Map
Nearby Homes
- 2312 NE Sweet Water Dr
- 416 NE Bitter Creek Rd
- 2504 NE Woodland Oak Cir
- 2313 NE Old Paint Rd
- 514 NE Viewpark Dr
- 2504 NE Dale Hunter Trail
- 2505 NE Dale Hunter Trail
- 304 SE Wood Ln
- 214 SE Windsboro Ct
- 1032 NE Bristol Dr
- 201 SE Somerset Dr
- 354 SE Wood Ln
- 321 SE Golden Ln
- 406 NE Keystone Dr
- 1016 NE Remington Ct
- 2000 NE Dill Dr
- 23808 E Langsford Rd
- 1928 NE Dill Cir
- 258 SE Topaz Cir
- 1916 NE Patterson Dr
- 2513 NE Indian Pointe
- 2520 NE Angel Fish Place
- 2521 NE Indian Pointe
- 2516 NE Angel Fish Place
- 2512 NE Angel Fish Place
- 2509 NE Indian Pointe
- 2516 NE Indian Pointe
- 2524 NE Angel Fish Place
- 2520 NE Indian Pointe
- 2508 NE Angel Fish Place
- 2512 NE Indian Pointe
- 2505 NE Indian Pointe
- 2508 NE Indian Pointe
- 2528 NE Angel Fish Place
- 2504 NE Angel Fish Place
- 2504 NE Indian Pointe
- 2517 NE Angel Fish Place
- 2501 NE Indian Pointe
- 10704 NE Blackwell Rd
- 2513 NE Angel Fish Place