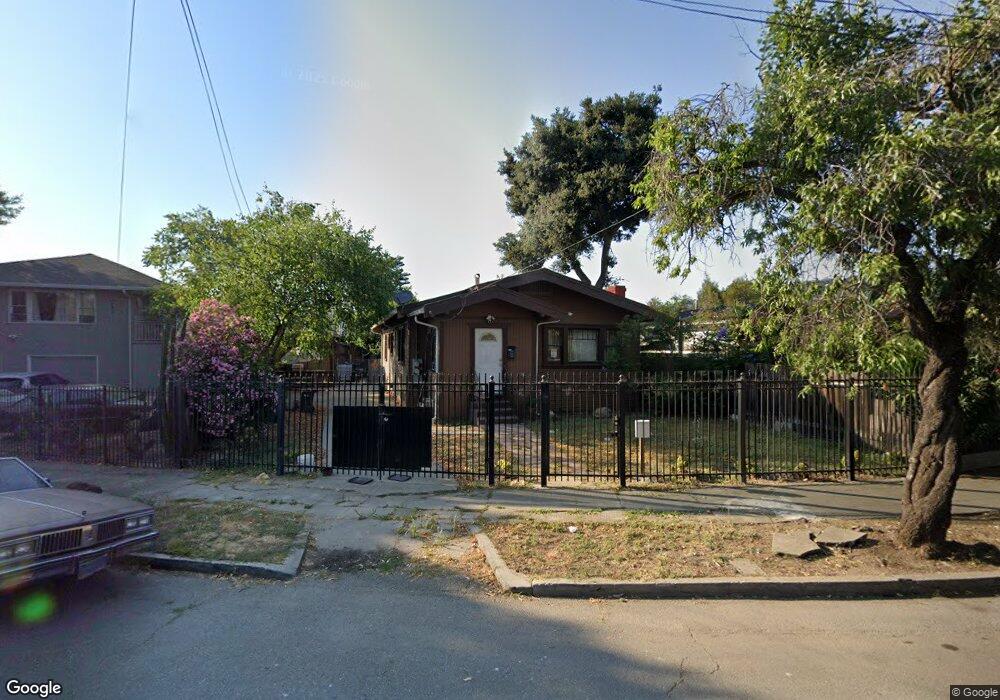
2517 Ritchie St Oakland, CA 94605
Eastmont NeighborhoodEstimated Value: $576,000 - $699,805
3
Beds
2
Baths
1,426
Sq Ft
$447/Sq Ft
Est. Value
About This Home
This home is located at 2517 Ritchie St, Oakland, CA 94605 and is currently estimated at $637,903, approximately $447 per square foot. 2517 Ritchie St is a home located in Alameda County with nearby schools including East Oakland Pride Elementary School, Frick United Academy of Language, and Coliseum College Prep Academy.
Ownership History
Date
Name
Owned For
Owner Type
Purchase Details
Closed on
May 28, 1999
Sold by
Bealwilliams Marguerite and Williams Terry
Bought by
Hornyak Carmen
Current Estimated Value
Home Financials for this Owner
Home Financials are based on the most recent Mortgage that was taken out on this home.
Original Mortgage
$148,723
Outstanding Balance
$38,739
Interest Rate
6.9%
Mortgage Type
FHA
Estimated Equity
$599,164
Create a Home Valuation Report for This Property
The Home Valuation Report is an in-depth analysis detailing your home's value as well as a comparison with similar homes in the area
Home Values in the Area
Average Home Value in this Area
Purchase History
| Date | Buyer | Sale Price | Title Company |
|---|---|---|---|
| Hornyak Carmen | $150,000 | Old Republic Title Company |
Source: Public Records
Mortgage History
| Date | Status | Borrower | Loan Amount |
|---|---|---|---|
| Open | Hornyak Carmen | $148,723 |
Source: Public Records
Tax History Compared to Growth
Tax History
| Year | Tax Paid | Tax Assessment Tax Assessment Total Assessment is a certain percentage of the fair market value that is determined by local assessors to be the total taxable value of land and additions on the property. | Land | Improvement |
|---|---|---|---|---|
| 2025 | $12,004 | $227,985 | $70,542 | $164,443 |
| 2024 | $12,004 | $223,379 | $69,160 | $161,219 |
| 2023 | $8,148 | $225,863 | $67,804 | $158,059 |
| 2022 | $6,722 | $214,434 | $66,474 | $154,960 |
| 2021 | $8,199 | $210,093 | $65,171 | $151,922 |
| 2020 | $5,143 | $214,867 | $64,503 | $150,364 |
| 2019 | $4,334 | $210,655 | $63,238 | $147,417 |
| 2018 | $4,241 | $206,526 | $61,999 | $144,527 |
| 2017 | $4,029 | $202,476 | $60,783 | $141,693 |
| 2016 | $3,829 | $198,507 | $59,592 | $138,915 |
| 2015 | $3,801 | $195,526 | $58,697 | $136,829 |
| 2014 | $3,884 | $191,696 | $57,547 | $134,149 |
Source: Public Records
Map
Nearby Homes
- 2221 80th Ave
- 7940 Bancroft Ave
- 0 Bancroft Ave
- 2023 80th Ave
- 2657 79th Ave
- 2311 82nd Ave
- 2626 78th Ave
- 7701 Bancroft Ave
- 7700 Garfield Ave
- 2640 77th Ave
- 2644 77th Ave
- 2250 83rd Ave
- 1927 82nd Ave
- 8039 Idlewood St
- 2353 83rd Ave
- 2522 75th Ave
- 1954 84th Ave
- 2625 75th Ave
- 2326 Maywood Ave
- 8016 Macarthur Blvd