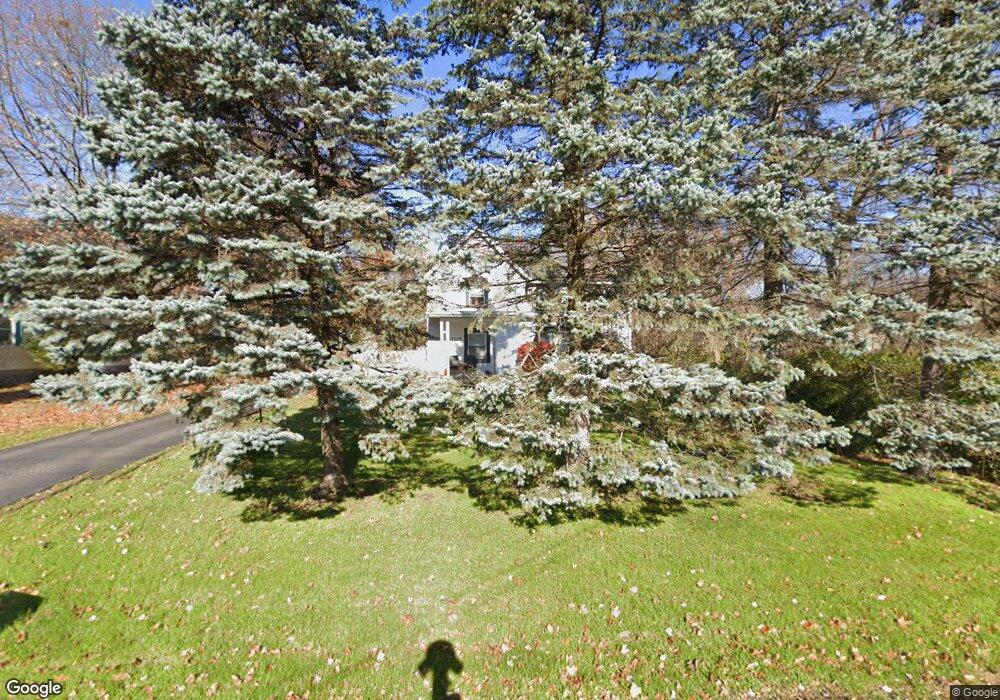
2519 Forest Rd Lansing, MI 48910
Forest View NeighborhoodEstimated Value: $206,951 - $259,000
--
Bed
1
Bath
2,258
Sq Ft
$103/Sq Ft
Est. Value
About This Home
This home is located at 2519 Forest Rd, Lansing, MI 48910 and is currently estimated at $233,488, approximately $103 per square foot. 2519 Forest Rd is a home located in Ingham County with nearby schools including Forest View School, Pattengill Academy, and Eastern High School.
Ownership History
Date
Name
Owned For
Owner Type
Purchase Details
Closed on
Jan 30, 2007
Sold by
Fannie Mae
Bought by
Cooley Mitchell R and Cooley Deborah R
Current Estimated Value
Home Financials for this Owner
Home Financials are based on the most recent Mortgage that was taken out on this home.
Original Mortgage
$89,600
Outstanding Balance
$53,994
Interest Rate
6.27%
Mortgage Type
Purchase Money Mortgage
Estimated Equity
$179,494
Purchase Details
Closed on
May 1, 2006
Sold by
Countrywide Home Loans Inc
Bought by
Federal National Mortgage Association
Purchase Details
Closed on
Apr 13, 2006
Sold by
Rayle Brenda L
Bought by
Countrywide Home Loans Inc
Purchase Details
Closed on
Apr 9, 2001
Sold by
Fischer Dean W and Fischer Brenda L
Bought by
Fischer Brenda L
Home Financials for this Owner
Home Financials are based on the most recent Mortgage that was taken out on this home.
Original Mortgage
$108,300
Interest Rate
7.05%
Mortgage Type
Purchase Money Mortgage
Create a Home Valuation Report for This Property
The Home Valuation Report is an in-depth analysis detailing your home's value as well as a comparison with similar homes in the area
Home Values in the Area
Average Home Value in this Area
Purchase History
| Date | Buyer | Sale Price | Title Company |
|---|---|---|---|
| Cooley Mitchell R | $112,000 | Fatic | |
| Federal National Mortgage Association | -- | None Available | |
| Countrywide Home Loans Inc | $112,960 | None Available | |
| Fischer Brenda L | -- | Midstate Title Company |
Source: Public Records
Mortgage History
| Date | Status | Borrower | Loan Amount |
|---|---|---|---|
| Open | Cooley Mitchell R | $89,600 | |
| Previous Owner | Fischer Brenda L | $108,300 |
Source: Public Records
Tax History Compared to Growth
Tax History
| Year | Tax Paid | Tax Assessment Tax Assessment Total Assessment is a certain percentage of the fair market value that is determined by local assessors to be the total taxable value of land and additions on the property. | Land | Improvement |
|---|---|---|---|---|
| 2025 | $3,353 | $94,200 | $11,400 | $82,800 |
| 2024 | $27 | $87,500 | $11,400 | $76,100 |
| 2023 | $3,143 | $77,100 | $11,400 | $65,700 |
| 2022 | $2,832 | $71,400 | $8,600 | $62,800 |
| 2021 | $2,774 | $65,600 | $6,400 | $59,200 |
| 2020 | $2,757 | $63,500 | $6,400 | $57,100 |
| 2019 | $2,643 | $57,800 | $6,400 | $51,400 |
| 2018 | $2,476 | $50,300 | $6,400 | $43,900 |
| 2017 | $2,371 | $50,300 | $6,400 | $43,900 |
| 2016 | $2,183 | $44,200 | $6,400 | $37,800 |
| 2015 | $2,183 | $41,000 | $12,806 | $28,194 |
| 2014 | $2,183 | $38,800 | $5,433 | $33,367 |
Source: Public Records
Map
Nearby Homes
- 2528 Windbreak Ln Unit 13
- 2505 Arbor Forest Dr Unit 11
- 2727 Aurora Dr
- 2626 Forest Rd
- 2015 Forest Rd
- 2901 Staten Ave Unit 14
- 3205 Aurelius Rd
- 2017 Greenwich Ct Unit 20
- 3725 Stoneleigh Dr
- 2237 Sunnyside Ave
- 0 E Mount Hope Ave
- 2300 Sunnyside Ave
- 2011 Clifton Ave
- 4207 Aurelius Rd
- 2215 Alpha St
- 1620 Clifton Ave
- 1221 Pershing Dr
- 2309 S Pennsylvania Ave
- 2201 S Pennsylvania Ave
- 2340 S Pennsylvania Ave
- 2513 Forest Rd
- 2500 Windbreak Ln Unit 20
- 2504 Windbreak Ln Unit 19
- 2525 Forest Rd
- 2508 Windbreak Ln Unit 18
- 2525 Arbor Forest Dr Unit 16
- 2431 Forest Rd
- 2512 Windbreak Ln Unit 17
- 2507 Windbreak Ln
- 2501 Windbreak Ln Unit 21
- 2710 Stoneleigh Dr
- 2520 Arbor Forest Dr
- 2715 Manley Dr
- 2600 Forest Rd
- 2521 Arbor Forest Dr Unit 15
- 2518 Arbor Unit 2
- 2518 Arbor
- 2518 Arbor Forest Dr Unit 2
- 2516 Windbreak Ln Unit 16