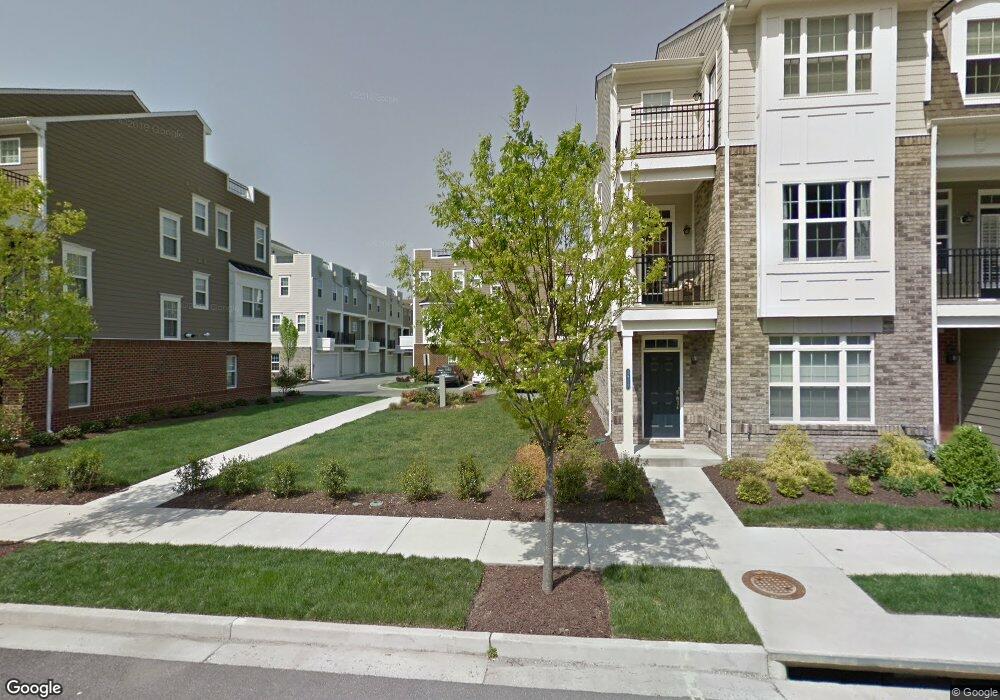
2519 Perch Ln Unit 45C Glen Allen, VA 23060
Short Pump NeighborhoodEstimated Value: $523,628 - $552,000
3
Beds
4
Baths
2,031
Sq Ft
$263/Sq Ft
Est. Value
About This Home
This home is located at 2519 Perch Ln Unit 45C, Glen Allen, VA 23060 and is currently estimated at $534,907, approximately $263 per square foot. 2519 Perch Ln Unit 45C is a home located in Henrico County with nearby schools including Colonial Trail Elementary School, Short Pump Middle School, and Deep Run High School.
Ownership History
Date
Name
Owned For
Owner Type
Purchase Details
Closed on
Jan 19, 2024
Sold by
Byrd Amanda
Bought by
Laaser Jonathan and Laaser Renee Joann
Current Estimated Value
Home Financials for this Owner
Home Financials are based on the most recent Mortgage that was taken out on this home.
Original Mortgage
$485,000
Outstanding Balance
$475,953
Interest Rate
6.61%
Mortgage Type
New Conventional
Estimated Equity
$58,955
Purchase Details
Closed on
Apr 6, 2020
Sold by
Hollander Caryn Malkman
Bought by
Byrd Amanda
Purchase Details
Closed on
Jul 22, 2013
Sold by
Kornblau Chelsea
Bought by
Malkman Caryn
Home Financials for this Owner
Home Financials are based on the most recent Mortgage that was taken out on this home.
Original Mortgage
$274,000
Interest Rate
3.95%
Mortgage Type
New Conventional
Purchase Details
Closed on
Feb 14, 2012
Sold by
Eagle Const Of Va Properties
Bought by
Kornblau Chelsea
Home Financials for this Owner
Home Financials are based on the most recent Mortgage that was taken out on this home.
Original Mortgage
$259,797
Interest Rate
3.89%
Mortgage Type
New Conventional
Create a Home Valuation Report for This Property
The Home Valuation Report is an in-depth analysis detailing your home's value as well as a comparison with similar homes in the area
Home Values in the Area
Average Home Value in this Area
Purchase History
| Date | Buyer | Sale Price | Title Company |
|---|---|---|---|
| Laaser Jonathan | $500,000 | Fidelity National Title | |
| Laaser Jonathan | $500,000 | Fidelity National Title | |
| Byrd Amanda | $418,000 | Attorney | |
| Malkman Caryn | $374,000 | -- | |
| Kornblau Chelsea | $324,747 | -- |
Source: Public Records
Mortgage History
| Date | Status | Borrower | Loan Amount |
|---|---|---|---|
| Open | Laaser Jonathan | $485,000 | |
| Closed | Laaser Jonathan | $485,000 | |
| Previous Owner | Malkman Caryn | $274,000 | |
| Previous Owner | Kornblau Chelsea | $259,797 |
Source: Public Records
Tax History Compared to Growth
Tax History
| Year | Tax Paid | Tax Assessment Tax Assessment Total Assessment is a certain percentage of the fair market value that is determined by local assessors to be the total taxable value of land and additions on the property. | Land | Improvement |
|---|---|---|---|---|
| 2025 | $4,181 | $491,400 | $115,000 | $376,400 |
| 2024 | $4,181 | $482,000 | $115,000 | $367,000 |
| 2023 | $4,097 | $482,000 | $115,000 | $367,000 |
| 2022 | $3,735 | $439,400 | $95,000 | $344,400 |
| 2021 | $3,507 | $403,100 | $85,000 | $318,100 |
| 2020 | $3,507 | $403,100 | $85,000 | $318,100 |
| 2019 | $3,507 | $403,100 | $85,000 | $318,100 |
| 2018 | $3,507 | $403,100 | $85,000 | $318,100 |
| 2017 | $3,427 | $393,900 | $85,000 | $308,900 |
| 2016 | $3,349 | $384,900 | $85,000 | $299,900 |
| 2015 | $3,022 | $384,900 | $85,000 | $299,900 |
| 2014 | $3,022 | $347,400 | $85,000 | $262,400 |
Source: Public Records
Map
Nearby Homes
- 2527 Perch Ln
- 115 Wellie Hill Place Unit A
- 1704 Old Brick Rd Unit A
- 1724 Old Brick Rd Unit A
- 3928 Lantern View Place
- 3932 Lantern View Place
- Linden Terrace Plan at West Broad Village
- Hartford Terrace Plan at West Broad Village
- 11629 Hainesland Dr
- 11464 Sligo Dr
- 0 Sligo Dr
- 11468 Sligo Dr
- 11568 Chapman Mill Dr
- Everly Plan at Sadler Square
- Arden Plan at Sadler Square
- Crosby Plan at Sadler Square
- 11600 Coachmans Carriage Place
- 11709 Sandy Bluff Dr
- 0 Belfast Rd Unit 2511329
- 3627 Notch Trail Ln Unit A
- 2519 Perch Ln
- 2521 Perch Ln Unit 46C
- 2521 Perch Ln
- 2521 Perch Ln
- 2517 Perch Ln
- 2523 Perch Ln
- 2523 Perch Ln Unit 47C
- 2525 Perch Ln
- 2525 Perch Ln Unit 48C
- 2515 Perch Ln Unit 43C
- 2515 Perch Ln
- 2518 Liesfeld Pkwy Unit 2518
- 2518 Liesfeld Pkwy
- 2520 Liesfeld Pkwy Unit 25C
- 2520 Liesfeld Pkwy
- 2527 Perch Ln Unit 49C
- 3912 Brownstone Blvd
- 3910 Brownstone Blvd Unit 3910
- 2513 Perch Ln
- 3914 Brownstone Blvd Unit 3914