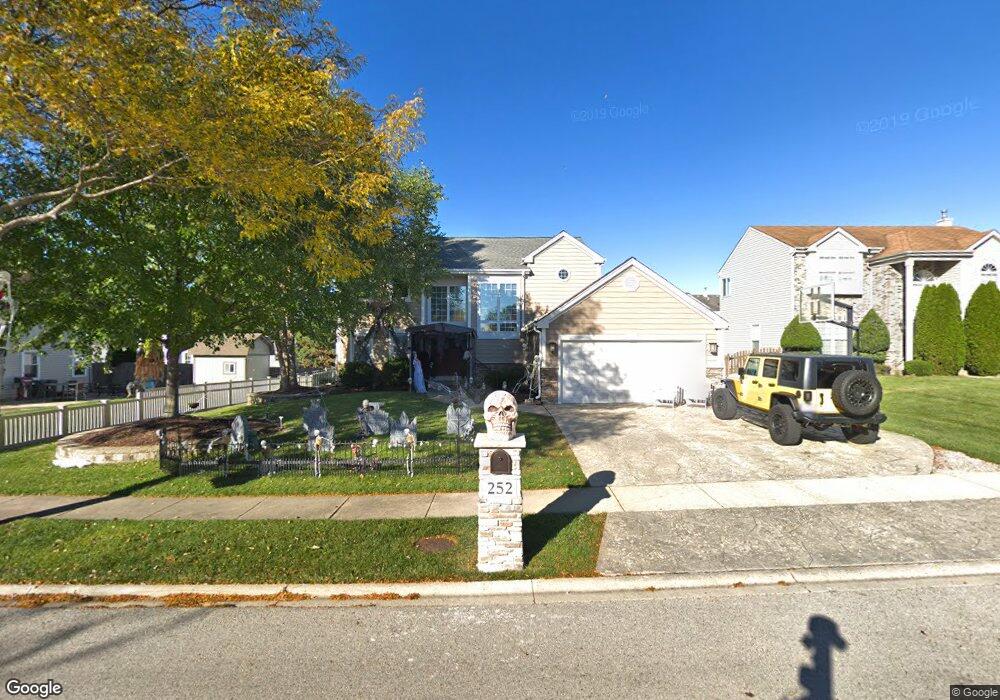
252 Cedarfield Dr Bartlett, IL 60103
Estimated Value: $471,924 - $489,000
4
Beds
3
Baths
2,154
Sq Ft
$222/Sq Ft
Est. Value
About This Home
This home is located at 252 Cedarfield Dr, Bartlett, IL 60103 and is currently estimated at $478,481, approximately $222 per square foot. 252 Cedarfield Dr is a home located in Cook County with nearby schools including Nature Ridge Elementary School, Kenyon Woods Middle School, and South Elgin High School.
Ownership History
Date
Name
Owned For
Owner Type
Purchase Details
Closed on
Jan 21, 2004
Sold by
Bouhuys Michael C and Bouhuys Cheryl Ann
Bought by
Bouhuys Cheryl Ann and Bouhuys Michael C
Current Estimated Value
Purchase Details
Closed on
Sep 30, 2003
Sold by
Bouhuys Michael C and Bouhuys Cheryl A
Bought by
Bouhuys Michael C and Bouhuys Cheryl A
Home Financials for this Owner
Home Financials are based on the most recent Mortgage that was taken out on this home.
Original Mortgage
$165,500
Outstanding Balance
$73,180
Interest Rate
5.91%
Mortgage Type
New Conventional
Estimated Equity
$405,301
Purchase Details
Closed on
Sep 1, 1995
Sold by
Centex Real Estate Corp
Bought by
Bouhuys Michael C and Phelps Cheryl A
Home Financials for this Owner
Home Financials are based on the most recent Mortgage that was taken out on this home.
Original Mortgage
$168,150
Interest Rate
7.8%
Create a Home Valuation Report for This Property
The Home Valuation Report is an in-depth analysis detailing your home's value as well as a comparison with similar homes in the area
Home Values in the Area
Average Home Value in this Area
Purchase History
| Date | Buyer | Sale Price | Title Company |
|---|---|---|---|
| Bouhuys Cheryl Ann | -- | -- | |
| Bouhuys Michael C | -- | Transtar National Title | |
| Bouhuys Michael C | $177,500 | -- |
Source: Public Records
Mortgage History
| Date | Status | Borrower | Loan Amount |
|---|---|---|---|
| Open | Bouhuys Michael C | $165,500 | |
| Closed | Bouhuys Michael C | $168,150 |
Source: Public Records
Tax History
| Year | Tax Paid | Tax Assessment Tax Assessment Total Assessment is a certain percentage of the fair market value that is determined by local assessors to be the total taxable value of land and additions on the property. | Land | Improvement |
|---|---|---|---|---|
| 2025 | $10,535 | $44,000 | $8,418 | $35,582 |
| 2024 | $10,535 | $36,000 | $7,155 | $28,845 |
| 2023 | $10,156 | $36,000 | $7,155 | $28,845 |
| 2022 | $10,156 | $36,000 | $7,155 | $28,845 |
| 2021 | $9,609 | $28,619 | $6,313 | $22,306 |
| 2020 | $9,553 | $28,619 | $6,313 | $22,306 |
| 2019 | $9,470 | $31,799 | $6,313 | $25,486 |
| 2018 | $9,352 | $29,104 | $5,471 | $23,633 |
| 2017 | $9,210 | $29,104 | $5,471 | $23,633 |
| 2016 | $8,896 | $29,104 | $5,471 | $23,633 |
| 2015 | $8,465 | $25,994 | $4,840 | $21,154 |
| 2014 | $8,373 | $25,994 | $4,840 | $21,154 |
| 2013 | $8,022 | $25,994 | $4,840 | $21,154 |
Source: Public Records
Map
Nearby Homes
- 220 Carroll Way
- 2068 Norwich Dr
- 1969 Osprey Ct Unit 223
- 171 Silbury Dr
- 127 5th Ave
- 106 8th Ave
- 521 Ivory Ln
- 995 Bluff Quarry Dr
- 1627 Spaulding Rd Unit 524
- 1088 Center Dr
- 1499 Deer Pointe Dr
- 303 Ann St
- 610 Golfers Ln
- 720 Thornbury Rd Unit 1115
- 1017 Atterberg Rd
- 1066 Moraine Dr
- 1004 Atterberg Rd
- 399 Fulton St Unit 2
- 1316 Foxglove Dr
- 1314 Foxglove Dr
- 248 Cedarfield Dr
- 2020 Westridge Blvd
- 2024 Westridge Blvd
- 249 Norwich Dr
- 245 Norwich Dr
- 244 Cedarfield Dr Unit 2
- 2028 Westridge Blvd
- 251 Cedarfield Dr
- 255 Cedarfield Dr
- 241 Norwich Dr
- 247 Cedarfield Dr
- 259 Cedarfield Dr
- 240 Cedarfield Dr
- 243 Cedarfield Dr
- 237 Norwich Dr
- 1992 Westridge Blvd
- 236 Cedarfield Dr
- 2019 Westridge Blvd
- 2036 Westridge Blvd
- 248 Norwich Dr
Your Personal Tour Guide
Ask me questions while you tour the home.