
Seller's Agent in 2018
Kyle Seyboth
Century 21 Limitless
(508) 726-3492
33 in this area
1,895 Total Sales
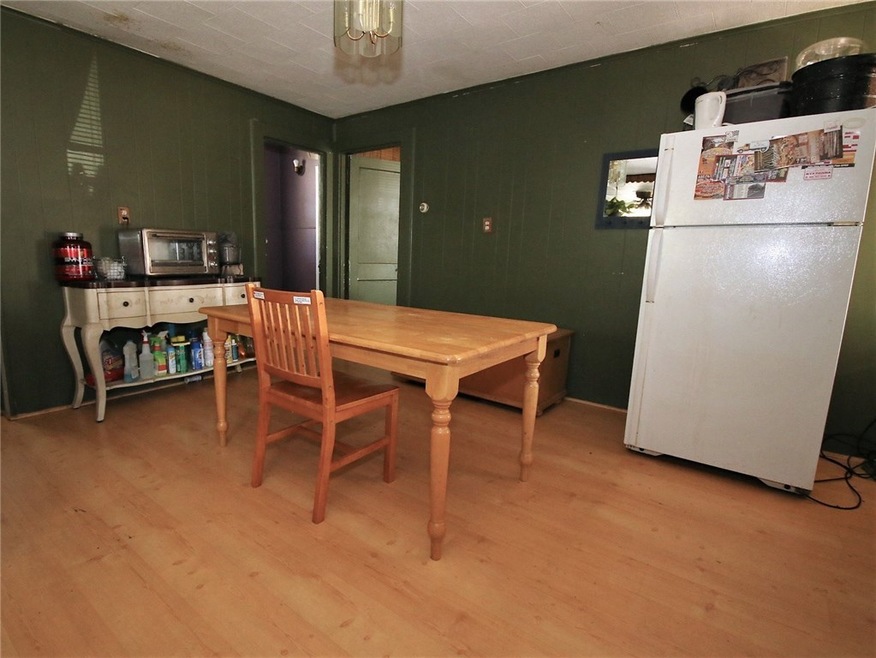
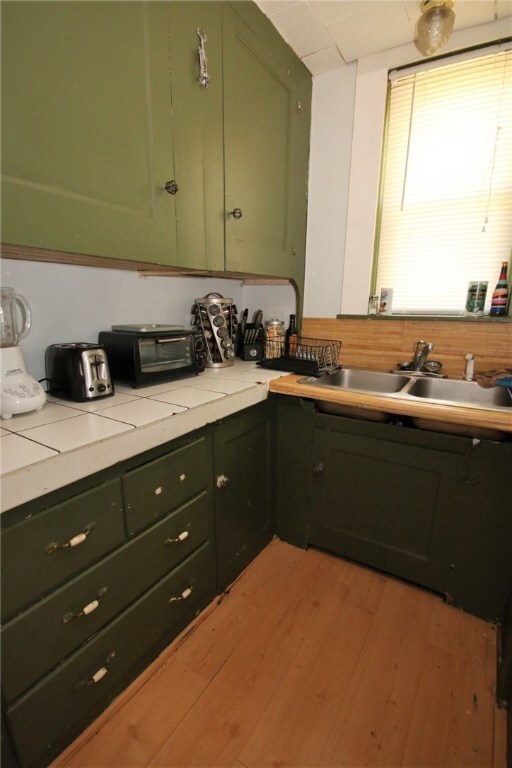
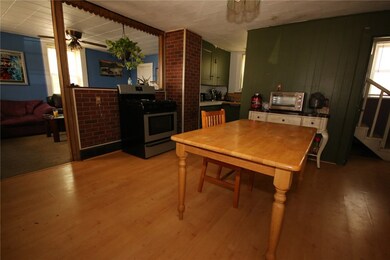
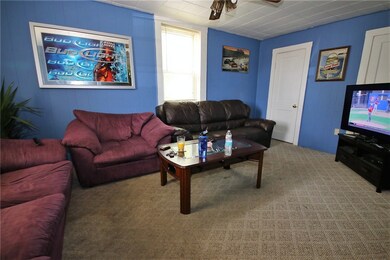
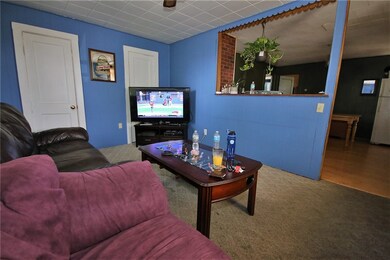

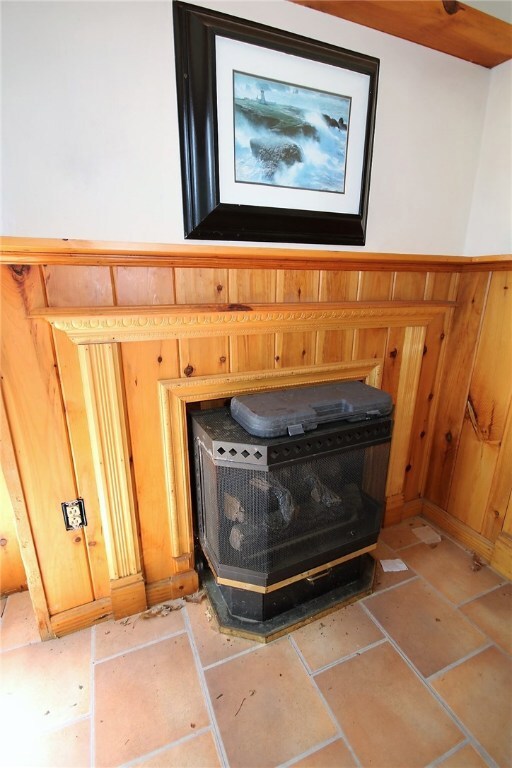
Three bedroom Home in Quiet Oak Grove Neighborhood. Updated Bathroom, Fenced In Yard and Easy Highway Access. Call Today For Your Private Showing!
Last Agent to Sell the Property
Spectrum Real Estate Consultants T
Keller Williams Leading Edge Listed on: 08/15/2017
Last Buyer's Agent
Kyle Seyboth
| Date | Type | Sale Price | Title Company |
|---|---|---|---|
| Warranty Deed | $174,000 | -- | |
| Warranty Deed | $82,000 | -- | |
| Warranty Deed | $174,000 | -- | |
| Warranty Deed | $82,000 | -- |
| Date | Status | Loan Amount | Loan Type |
|---|---|---|---|
| Open | $174,000 | VA | |
| Closed | $174,000 | VA | |
| Previous Owner | $10,000 | Purchase Money Mortgage | |
| Previous Owner | $51,500 | No Value Available |
| Date | Event | Price | Change | Sq Ft Price |
|---|---|---|---|---|
| 07/10/2018 07/10/18 | Sold | $167,000 | -1.7% | $134 / Sq Ft |
| 06/10/2018 06/10/18 | Pending | -- | -- | -- |
| 04/16/2018 04/16/18 | For Sale | $169,900 | +107.2% | $136 / Sq Ft |
| 10/13/2017 10/13/17 | Sold | $82,000 | +2.6% | $66 / Sq Ft |
| 09/13/2017 09/13/17 | Pending | -- | -- | -- |
| 08/15/2017 08/15/17 | For Sale | $79,900 | -- | $64 / Sq Ft |
| Year | Tax Paid | Tax Assessment Tax Assessment Total Assessment is a certain percentage of the fair market value that is determined by local assessors to be the total taxable value of land and additions on the property. | Land | Improvement |
|---|---|---|---|---|
| 2024 | $3,050 | $209,800 | $80,600 | $129,200 |
| 2023 | $2,933 | $209,800 | $80,600 | $129,200 |
| 2022 | $2,933 | $209,800 | $80,600 | $129,200 |
| 2021 | $2,757 | $116,100 | $62,100 | $54,000 |
| 2020 | $2,786 | $116,100 | $62,100 | $54,000 |
| 2018 | $2,796 | $116,100 | $62,100 | $54,000 |
| 2017 | $3,200 | $106,300 | $59,800 | $46,500 |
| 2016 | $3,385 | $106,300 | $59,800 | $46,500 |
| 2015 | $3,888 | $106,300 | $59,800 | $46,500 |
| 2014 | $4,061 | $113,000 | $65,800 | $47,200 |
Seller's Agent in 2018
Kyle Seyboth
Century 21 Limitless
(508) 726-3492
33 in this area
1,895 Total Sales
Buyer's Agent in 2018
Jeff Silva
RE/MAX Real Estate Center
(508) 889-4625
47 Total Sales
Seller's Agent in 2017
Spectrum Real Estate Consultants T
Keller Williams Leading Edge
(401) 333-4900
30 in this area
386 Total Sales
Source: State-Wide MLS
MLS Number: 1170787
APN: WOON-000044F-000082-000010
Disclaimer: Certain information contained herein is derived from information provided by parties other than Homes.com. All information provided is deemed reliable, but is not guaranteed to be accurate and should be independently verified.
![]() IDX information is provided exclusively for personal, non-commercial use, and may not be used for any purpose other than to identify prospective properties consumers may be interested in purchasing. Information is deemed reliable but not guaranteed.
IDX information is provided exclusively for personal, non-commercial use, and may not be used for any purpose other than to identify prospective properties consumers may be interested in purchasing. Information is deemed reliable but not guaranteed.
Copyright © 2025 State-Wide MLS, Inc. All rights reserved.