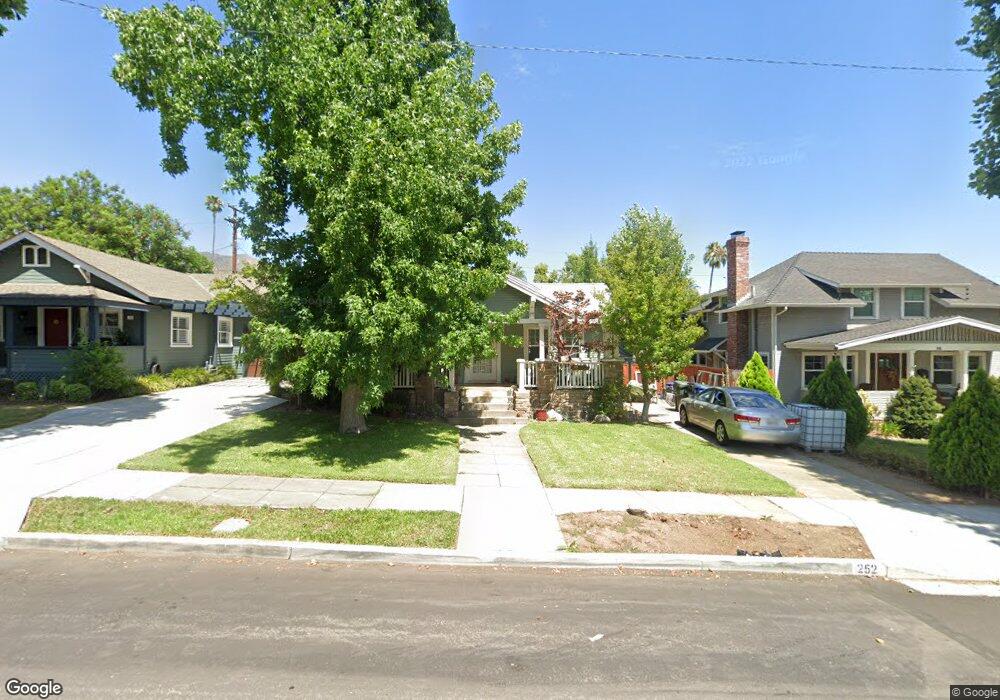
252 N Encinitas Ave Monrovia, CA 91016
Estimated Value: $1,025,523 - $1,224,000
2
Beds
1
Bath
1,413
Sq Ft
$805/Sq Ft
Est. Value
About This Home
This home is located at 252 N Encinitas Ave, Monrovia, CA 91016 and is currently estimated at $1,137,131, approximately $804 per square foot. 252 N Encinitas Ave is a home located in Los Angeles County with nearby schools including Mayflower Elementary School, Clifton Middle School, and Monrovia High School.
Ownership History
Date
Name
Owned For
Owner Type
Purchase Details
Closed on
Jul 9, 2019
Sold by
Fournier Douglas R and Fournier Ruth S
Bought by
Fournier Ruth S
Current Estimated Value
Purchase Details
Closed on
Jun 18, 1999
Sold by
Heralda Mark D and Heralda Joann
Bought by
Fournier Douglas R
Home Financials for this Owner
Home Financials are based on the most recent Mortgage that was taken out on this home.
Original Mortgage
$216,000
Interest Rate
7.64%
Purchase Details
Closed on
Mar 19, 1996
Sold by
Johnson Mary Lynn
Bought by
Heralda Mark D and Heralda Joann
Home Financials for this Owner
Home Financials are based on the most recent Mortgage that was taken out on this home.
Original Mortgage
$206,150
Interest Rate
7.84%
Purchase Details
Closed on
Sep 28, 1993
Sold by
Taylor Daniel J and Taylor Lisa A
Bought by
Johnson Mary Lynn
Create a Home Valuation Report for This Property
The Home Valuation Report is an in-depth analysis detailing your home's value as well as a comparison with similar homes in the area
Home Values in the Area
Average Home Value in this Area
Purchase History
| Date | Buyer | Sale Price | Title Company |
|---|---|---|---|
| Fournier Ruth S | $140,000 | None Available | |
| Fournier Douglas R | $270,000 | First American | |
| Heralda Mark D | $217,000 | United Title Company | |
| Johnson Mary Lynn | -- | -- |
Source: Public Records
Mortgage History
| Date | Status | Borrower | Loan Amount |
|---|---|---|---|
| Previous Owner | Fournier Douglas R | $216,000 | |
| Previous Owner | Heralda Mark D | $206,150 |
Source: Public Records
Tax History Compared to Growth
Tax History
| Year | Tax Paid | Tax Assessment Tax Assessment Total Assessment is a certain percentage of the fair market value that is determined by local assessors to be the total taxable value of land and additions on the property. | Land | Improvement |
|---|---|---|---|---|
| 2025 | $5,811 | $414,961 | $262,198 | $152,763 |
| 2024 | $5,811 | $406,825 | $257,057 | $149,768 |
| 2023 | $5,680 | $398,849 | $252,017 | $146,832 |
| 2022 | $5,519 | $391,029 | $247,076 | $143,953 |
| 2021 | $5,409 | $383,363 | $242,232 | $141,131 |
| 2019 | $5,160 | $371,995 | $235,049 | $136,946 |
| 2018 | $5,001 | $364,702 | $230,441 | $134,261 |
| 2016 | $4,806 | $350,543 | $221,494 | $129,049 |
| 2015 | $4,702 | $345,278 | $218,167 | $127,111 |
| 2014 | $4,658 | $338,516 | $213,894 | $124,622 |
Source: Public Records
Map
Nearby Homes
- 314 May Ave
- 347 Stedman Place
- 375 N Canyon Blvd
- 220 W Hillcrest Blvd
- 235 E Foothill Blvd Unit B
- 116 N Canyon Blvd
- 411 Sierra Vista Ave
- 277 Aspen Dr
- 425 N Canyon Blvd
- 430 N Canyon Blvd
- 453 N Alta Vista Ave
- 135 N Shamrock Ave
- 711 Ocean View Ave
- 52 Hidden Valley Rd
- 327 E Lemon Ave
- 208 Highland Place
- 746 Valley View Ave
- 751 Ocean View Ave Unit A
- 582 N Alta Vista Ave
- 824 Ocean View Ave
- 256 N Encinitas Ave
- 246 N Encinitas Ave
- 244 N Encinitas Ave
- 260 N Encinitas Ave
- 251 N Ivy Ave Unit 1/2
- 251 N Ivy Ave
- 253 N Ivy Ave
- 264 N Encinitas Ave
- 242 N Encinitas Ave
- 241 N Ivy Ave
- 259 N Ivy Ave
- 251 N Encinitas Ave
- 255 N Encinitas Ave
- 247 N Encinitas Ave
- 239 N Ivy Ave
- 263 N Ivy Ave
- 268 N Encinitas Ave
- 236 N Encinitas Ave
- 271 N Encinitas Ave
- 243 N Encinitas Ave