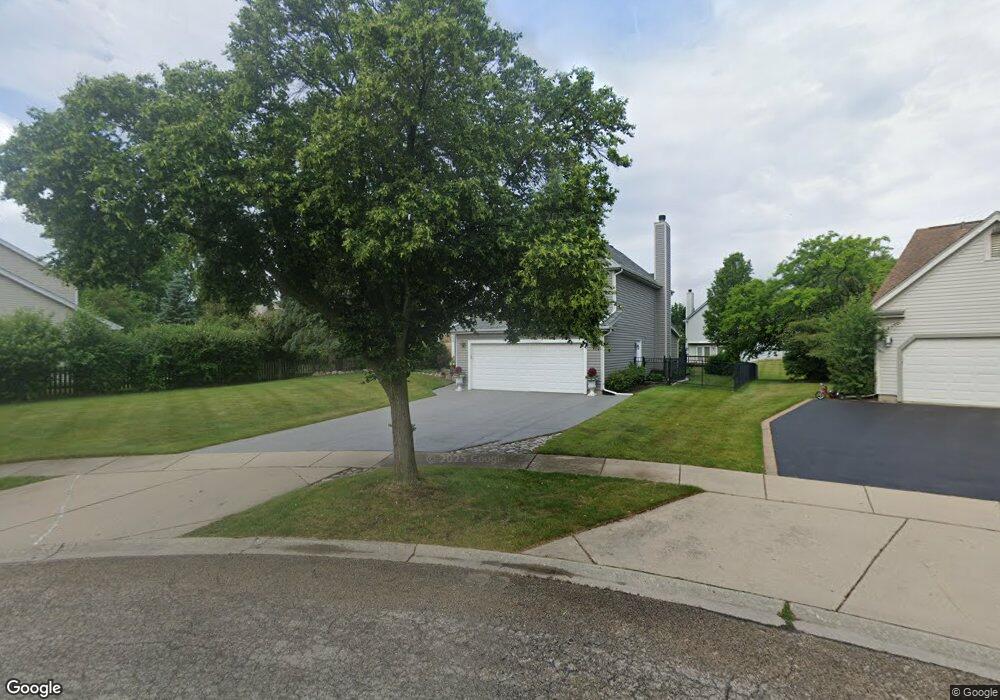
252 Stanton Ct E Buffalo Grove, IL 60089
Estimated Value: $603,000 - $653,386
3
Beds
3
Baths
2,713
Sq Ft
$236/Sq Ft
Est. Value
About This Home
This home is located at 252 Stanton Ct E, Buffalo Grove, IL 60089 and is currently estimated at $639,097, approximately $235 per square foot. 252 Stanton Ct E is a home located in Lake County with nearby schools including Meridian Middle School, Tripp Elementary School, and Aptakisic Junior High School.
Ownership History
Date
Name
Owned For
Owner Type
Purchase Details
Closed on
Oct 17, 2024
Sold by
Newman Harry S and Newman Jacqueline S
Bought by
Newman Family Revocable Living Trust and Newman
Current Estimated Value
Create a Home Valuation Report for This Property
The Home Valuation Report is an in-depth analysis detailing your home's value as well as a comparison with similar homes in the area
Home Values in the Area
Average Home Value in this Area
Purchase History
| Date | Buyer | Sale Price | Title Company |
|---|---|---|---|
| Newman Family Revocable Living Trust | -- | None Listed On Document |
Source: Public Records
Tax History Compared to Growth
Tax History
| Year | Tax Paid | Tax Assessment Tax Assessment Total Assessment is a certain percentage of the fair market value that is determined by local assessors to be the total taxable value of land and additions on the property. | Land | Improvement |
|---|---|---|---|---|
| 2024 | $14,371 | $171,987 | $49,606 | $122,381 |
| 2023 | $13,353 | $147,530 | $42,552 | $104,978 |
| 2022 | $13,353 | $142,676 | $41,152 | $101,524 |
| 2021 | $12,879 | $141,137 | $40,708 | $100,429 |
| 2020 | $12,628 | $141,619 | $40,847 | $100,772 |
| 2019 | $13,385 | $153,092 | $40,696 | $112,396 |
| 2018 | $13,399 | $152,972 | $49,153 | $103,819 |
| 2017 | $13,284 | $149,402 | $48,006 | $101,396 |
| 2016 | $12,767 | $143,065 | $45,970 | $97,095 |
| 2015 | $12,517 | $133,793 | $42,991 | $90,802 |
| 2014 | $12,027 | $127,409 | $46,171 | $81,238 |
| 2012 | $11,643 | $127,665 | $46,264 | $81,401 |
Source: Public Records
Map
Nearby Homes
- 276 Stanton Dr
- 22118 N Prairie Rd
- 16202 W Aptakisic Rd
- 2033 Olive Hill Dr
- 2071 Wright Blvd
- 15 Thompson Ct
- 268 Hoffmann Dr
- 361 Hoffmann Dr
- 333 Didier Ct
- 538 Lasalle Ct
- 10 Chestnut Ct E
- 437 Caren Dr
- 1012 Hobson Dr
- 5 Willow Pkwy Unit 892
- 913 Hobson Dr
- 22825 N Prairie Rd
- 381 Bentley Place
- 1901 Brandywyn Ln
- 1113 Lockwood Dr
- 61 Willow Pkwy Unit 731
- 250 Stanton Ct E Unit 8
- 254 Stanton Ct E
- 238 Stanton Ct W
- 246 Stanton Dr
- 248 Stanton Ct E
- 256 Stanton Ct E
- 240 Stanton Ct W
- 236 Stanton Ct W
- 236 Stanton Court Ct W
- 262 Stanton Ct E
- 242 Stanton Ct W
- 264 Stanton Ct E
- 258 Stanton Ct E
- 260 Stanton Ct E
- 266 Stanton Ct E
- 268 Stanton Ct E
- 234 Stanton Ct W
- 247 Stanton Dr
- 225 Stanton Dr
- 1657 Joseph Ct