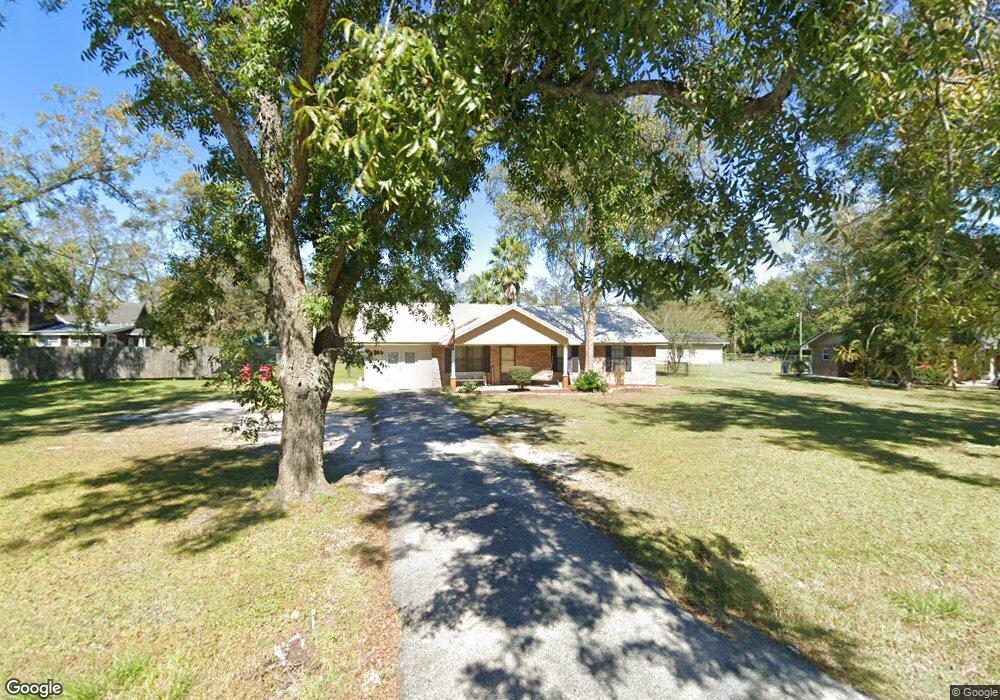
252 W Carter Ave Blackshear, GA 31516
Estimated Value: $169,000 - $229,000
3
Beds
2
Baths
1,272
Sq Ft
$155/Sq Ft
Est. Value
About This Home
This home is located at 252 W Carter Ave, Blackshear, GA 31516 and is currently estimated at $197,467, approximately $155 per square foot. 252 W Carter Ave is a home located in Pierce County with nearby schools including Pierce County High School, Southeast Christian Academy, and Truth Christian Academy.
Ownership History
Date
Name
Owned For
Owner Type
Purchase Details
Closed on
Jun 24, 2016
Sold by
Sec Of Housing & U
Bought by
Palmer Rebecca
Current Estimated Value
Home Financials for this Owner
Home Financials are based on the most recent Mortgage that was taken out on this home.
Original Mortgage
$84,350
Outstanding Balance
$69,001
Interest Rate
4.62%
Mortgage Type
FHA
Estimated Equity
$128,466
Purchase Details
Closed on
Jan 5, 2016
Sold by
Embrace Home Loans
Bought by
Sec Of Housing & Urban
Purchase Details
Closed on
Apr 3, 2009
Sold by
Murray James R
Bought by
Rodgers Charles C
Home Financials for this Owner
Home Financials are based on the most recent Mortgage that was taken out on this home.
Original Mortgage
$105,061
Interest Rate
5.18%
Mortgage Type
FHA
Purchase Details
Closed on
Oct 29, 2004
Sold by
Youmans Joseph L and Carter Pe
Bought by
Murray James R
Purchase Details
Closed on
May 31, 2001
Sold by
Aldridge Dwight D
Bought by
Youmans Joseph L and Carter Penny D
Purchase Details
Closed on
Aug 18, 1988
Bought by
Aldridge Dwight D
Purchase Details
Closed on
Sep 17, 1985
Sold by
Gaskin Mildred
Create a Home Valuation Report for This Property
The Home Valuation Report is an in-depth analysis detailing your home's value as well as a comparison with similar homes in the area
Home Values in the Area
Average Home Value in this Area
Purchase History
| Date | Buyer | Sale Price | Title Company |
|---|---|---|---|
| Palmer Rebecca | -- | -- | |
| Sec Of Housing & Urban | $97,371 | -- | |
| Rodgers Charles C | $107,000 | -- | |
| Murray James R | $94,000 | -- | |
| Youmans Joseph L | $77,000 | -- | |
| Aldridge Dwight D | -- | -- | |
| -- | -- | -- |
Source: Public Records
Mortgage History
| Date | Status | Borrower | Loan Amount |
|---|---|---|---|
| Open | Palmer Rebecca | $84,350 | |
| Previous Owner | Rodgers Charles C | $105,061 |
Source: Public Records
Tax History Compared to Growth
Tax History
| Year | Tax Paid | Tax Assessment Tax Assessment Total Assessment is a certain percentage of the fair market value that is determined by local assessors to be the total taxable value of land and additions on the property. | Land | Improvement |
|---|---|---|---|---|
| 2025 | $1,804 | $60,178 | $2,940 | $57,238 |
| 2024 | $1,804 | $57,928 | $2,940 | $54,988 |
| 2023 | $1,848 | $57,635 | $2,940 | $54,695 |
| 2022 | $1,580 | $41,597 | $3,770 | $37,827 |
| 2021 | $1,650 | $40,341 | $3,770 | $36,571 |
| 2020 | $1,619 | $39,086 | $3,770 | $35,316 |
| 2019 | $1,619 | $39,086 | $3,770 | $35,316 |
| 2018 | $1,571 | $37,830 | $3,770 | $34,060 |
| 2017 | $1,585 | $38,069 | $3,770 | $34,299 |
| 2016 | $1,379 | $33,196 | $3,770 | $29,426 |
| 2015 | $1,217 | $33,195 | $3,770 | $29,426 |
| 2014 | $1,217 | $33,196 | $3,770 | $29,426 |
| 2013 | $1,217 | $33,195 | $3,769 | $29,426 |
Source: Public Records
Map
Nearby Homes
- 515 Grady St
- 322 Mcgregor St
- 420 Jackson St
- 810 Jackson St
- 331 Central Ave W
- 3551 Cason Rd
- 0001 Georgia 121
- ST. ROUTE 121 Georgia 121
- 3360 Strickland Avenue Extension
- 3344 Strickland Ave
- 706 Jenkins St
- 622 E Main St
- 121 Beaver Dr
- 1157 Tanner Cir
- 862 Watson St
- 830 Jane St
- 131 Fawn Ln
- 2936 Piney Grove Cir
- 101 Fawn Ln
- TRACT 1 Trudie Rd