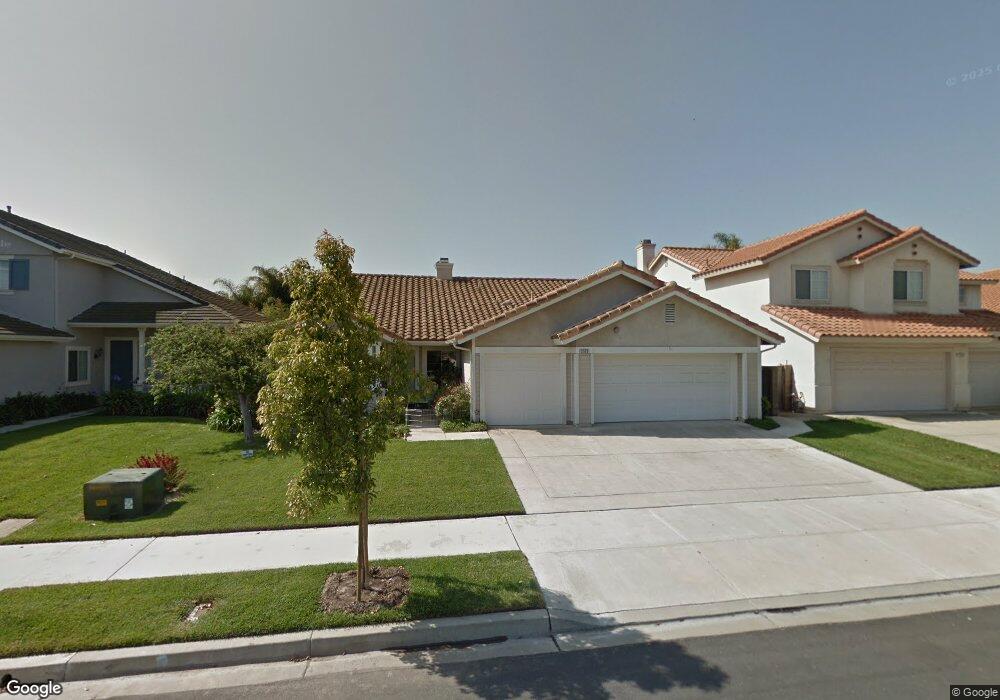
2520 New Haven Place Oxnard, CA 93035
Sea Air NeighborhoodEstimated Value: $879,000 - $976,000
4
Beds
2
Baths
2,133
Sq Ft
$439/Sq Ft
Est. Value
About This Home
This home is located at 2520 New Haven Place, Oxnard, CA 93035 and is currently estimated at $936,235, approximately $438 per square foot. 2520 New Haven Place is a home located in Ventura County with nearby schools including Juan Lagunas Soria Elementary School, Oxnard High School, and New Harvest Christian School.
Ownership History
Date
Name
Owned For
Owner Type
Purchase Details
Closed on
Oct 12, 2018
Sold by
Goeden Mary L
Bought by
Goeden Bradley J
Current Estimated Value
Purchase Details
Closed on
Jan 26, 2000
Sold by
Suriano James M and Suriano Michele M
Bought by
Goeden Bradley J and Goeden Mary L
Home Financials for this Owner
Home Financials are based on the most recent Mortgage that was taken out on this home.
Original Mortgage
$239,200
Interest Rate
8.38%
Purchase Details
Closed on
Apr 25, 1997
Sold by
The Pointe Oxnard Lp
Bought by
Suriano James M and Suriano Michele M
Home Financials for this Owner
Home Financials are based on the most recent Mortgage that was taken out on this home.
Original Mortgage
$210,425
Interest Rate
7.12%
Create a Home Valuation Report for This Property
The Home Valuation Report is an in-depth analysis detailing your home's value as well as a comparison with similar homes in the area
Home Values in the Area
Average Home Value in this Area
Purchase History
| Date | Buyer | Sale Price | Title Company |
|---|---|---|---|
| Goeden Bradley J | -- | None Available | |
| Goeden Bradley J | $299,000 | First American Title Ins Co | |
| Suriano James M | $221,500 | Chicago Title |
Source: Public Records
Mortgage History
| Date | Status | Borrower | Loan Amount |
|---|---|---|---|
| Previous Owner | Goeden Bradley J | $239,200 | |
| Previous Owner | Suriano James M | $210,425 | |
| Closed | Goeden Bradley J | $44,850 |
Source: Public Records
Tax History Compared to Growth
Tax History
| Year | Tax Paid | Tax Assessment Tax Assessment Total Assessment is a certain percentage of the fair market value that is determined by local assessors to be the total taxable value of land and additions on the property. | Land | Improvement |
|---|---|---|---|---|
| 2025 | $5,613 | $459,527 | $183,806 | $275,721 |
| 2024 | $5,613 | $450,517 | $180,202 | $270,315 |
| 2023 | $5,379 | $441,684 | $176,669 | $265,015 |
| 2022 | $5,221 | $433,024 | $173,205 | $259,819 |
| 2021 | $5,209 | $424,534 | $169,809 | $254,725 |
| 2020 | $5,302 | $420,183 | $168,069 | $252,114 |
| 2019 | $5,155 | $411,945 | $164,774 | $247,171 |
| 2018 | $5,082 | $403,869 | $161,544 | $242,325 |
| 2017 | $4,828 | $395,951 | $158,377 | $237,574 |
| 2016 | $4,662 | $388,188 | $155,272 | $232,916 |
| 2015 | $4,709 | $382,359 | $152,941 | $229,418 |
| 2014 | $4,657 | $374,871 | $149,946 | $224,925 |
Source: Public Records
Map
Nearby Homes
- 2230 New Haven Place
- 663 Novato Dr
- 623 Novato Dr
- 636 Ibiza Ln
- 1141 Bogota Ct
- 2401 El Portal Way
- 1161 Windward Way
- 3215 Kelp Ln
- 3225 Kelp Ln
- 2242 Miramar Walk
- 1309 Nautical Way
- 925 S L St
- 1241 Nautical Way Unit 160
- 1245 Jamaica Ln
- 1310 Anza Ct
- 3601 Via Pacifica Walk
- 930 Topsail Ct
- 3675 Via Pacifica Walk
- 150 S K St
- 1310 Hill St
- 2530 New Haven Place
- 2510 New Haven Place
- 2600 New Haven Place
- 2511 Oarfish Ln
- 2521 Oarfish Ln
- 736 Cornwall Dr
- 821 Oarfish Ct
- 811 Oarfish Ct
- 2531 Oarfish Ln
- 737 Binnacle St
- 2610 New Haven Place
- 2430 New Haven Place
- 831 Oarfish Ct
- 726 Cornwall Dr
- 2601 Oarfish Ln
- 727 Binnacle St
- 2611 New Haven Place
- 2620 New Haven Place
- 2420 New Haven Place
- 800 Oarfish Ct