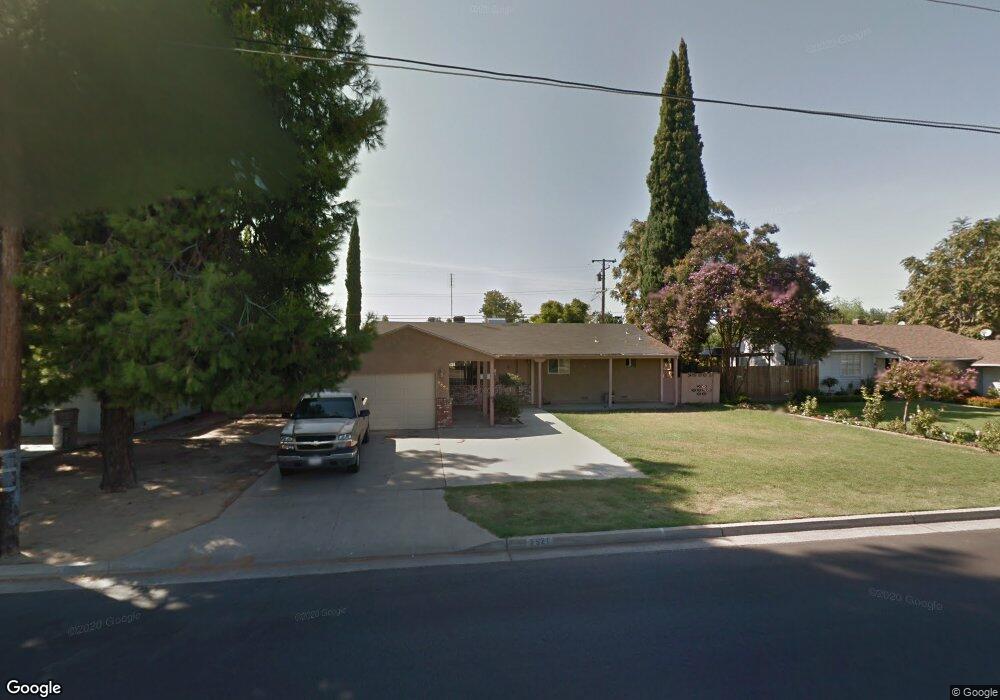
2521 N Chestnut Ave Fresno, CA 93703
McLane NeighborhoodEstimated Value: $316,974 - $356,000
3
Beds
2
Baths
1,456
Sq Ft
$234/Sq Ft
Est. Value
About This Home
This home is located at 2521 N Chestnut Ave, Fresno, CA 93703 and is currently estimated at $340,744, approximately $234 per square foot. 2521 N Chestnut Ave is a home located in Fresno County with nearby schools including Ericson Elementary School, Scandinavian Middle School, and Mclane High School.
Ownership History
Date
Name
Owned For
Owner Type
Purchase Details
Closed on
Jul 6, 2021
Sold by
Mendez Monica L
Bought by
Mendez Monica L and M L Mendez Living Trust
Current Estimated Value
Purchase Details
Closed on
Nov 9, 2010
Sold by
Beneficial Financial I Inc
Bought by
Mendez Monica L
Home Financials for this Owner
Home Financials are based on the most recent Mortgage that was taken out on this home.
Original Mortgage
$72,000
Outstanding Balance
$47,262
Interest Rate
4.17%
Mortgage Type
New Conventional
Estimated Equity
$293,482
Purchase Details
Closed on
Jul 23, 2010
Sold by
Murillo Louis and Murillo Darlene M
Bought by
Beneficial Financial I Inc
Create a Home Valuation Report for This Property
The Home Valuation Report is an in-depth analysis detailing your home's value as well as a comparison with similar homes in the area
Home Values in the Area
Average Home Value in this Area
Purchase History
| Date | Buyer | Sale Price | Title Company |
|---|---|---|---|
| Mendez Monica L | -- | None Available | |
| Mendez Monica L | $90,000 | None Available | |
| Beneficial Financial I Inc | $78,765 | Accommodation |
Source: Public Records
Mortgage History
| Date | Status | Borrower | Loan Amount |
|---|---|---|---|
| Open | Mendez Monica L | $72,000 |
Source: Public Records
Tax History Compared to Growth
Tax History
| Year | Tax Paid | Tax Assessment Tax Assessment Total Assessment is a certain percentage of the fair market value that is determined by local assessors to be the total taxable value of land and additions on the property. | Land | Improvement |
|---|---|---|---|---|
| 2025 | $1,408 | $114,654 | $38,430 | $76,224 |
| 2023 | $1,381 | $110,204 | $36,939 | $73,265 |
| 2022 | $1,363 | $108,044 | $36,215 | $71,829 |
| 2021 | $1,325 | $105,926 | $35,505 | $70,421 |
| 2020 | $1,320 | $104,840 | $35,141 | $69,699 |
| 2019 | $1,269 | $102,785 | $34,452 | $68,333 |
| 2018 | $1,242 | $100,771 | $33,777 | $66,994 |
| 2017 | $1,221 | $98,796 | $33,115 | $65,681 |
| 2016 | $1,180 | $96,860 | $32,466 | $64,394 |
| 2015 | $1,162 | $95,406 | $31,979 | $63,427 |
| 2014 | $1,141 | $93,538 | $31,353 | $62,185 |
Source: Public Records
Map
Nearby Homes
- 2441 N Chestnut Ave
- 4747 E Clinton Ave
- 4787 E Cornell Ave
- 4791 E Simpson Ave
- 4674 E Princeton Ave
- 4704 E Simpson Ave
- 4625 E Princeton Ave
- 2243 E Cambridge Ave
- 2238 N Maple Ave
- 4641 E Weldon Ave
- 4597 E Cambridge Ave
- 1745 N Winery Ave Unit 102
- 4875 E Mckinley Ave Unit 129
- 4843 E Oslin Ave
- 4819 E Home Ave
- 4808 E Pine Ave
- 4454 E Simpson Ave
- 4942 E Oslin Ave
- 4617 E Garland Ave
- 1431 N Willow Ave
- 2533 N Chestnut Ave
- 2509 N Chestnut Ave
- 2522 N Dearing Ave
- 2510 N Dearing Ave
- 2534 N Dearing Ave
- 2545 N Chestnut Ave
- 2546 N Dearing Ave
- 2442 N Dearing Ave
- 2514 N Chestnut Ave
- 2429 N Chestnut Ave
- 2542 N Chestnut Ave
- 2611 N Chestnut Ave
- 2610 N Dearing Ave
- 4775 E Terrace Ave
- 4774 E Harvard Ave
- 2621 N Chestnut Ave
- 4820 E Harvard Ave
- 4769 E Terrace Ave
- 4772 E Terrace Ave
- 2620 N Dearing Ave