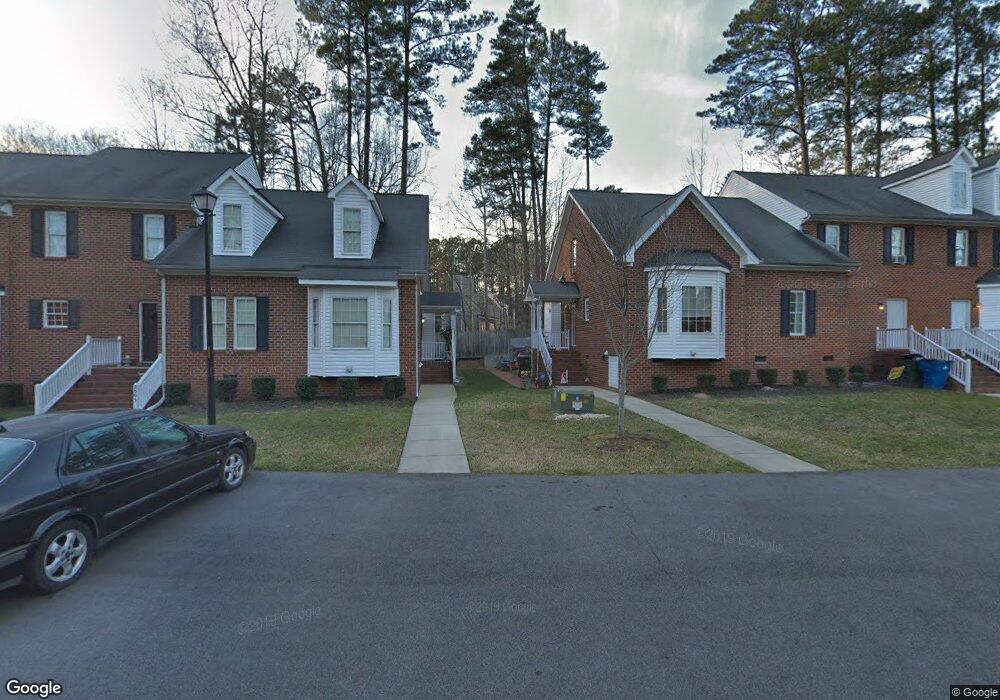
2521 Trout Stream Dr Unit 5 Raleigh, NC 27604
Northeast Raleigh NeighborhoodEstimated Value: $263,498 - $286,000
2
Beds
2
Baths
1,570
Sq Ft
$172/Sq Ft
Est. Value
About This Home
This home is located at 2521 Trout Stream Dr Unit 5, Raleigh, NC 27604 and is currently estimated at $270,625, approximately $172 per square foot. 2521 Trout Stream Dr Unit 5 is a home located in Wake County with nearby schools including Durant Road Elementary, Durant Road Middle, and Millbrook High School.
Ownership History
Date
Name
Owned For
Owner Type
Purchase Details
Closed on
Mar 15, 2007
Sold by
Bullard Lucille G and Bullard Elbert
Bought by
Baugh Molly Anne
Current Estimated Value
Home Financials for this Owner
Home Financials are based on the most recent Mortgage that was taken out on this home.
Original Mortgage
$125,000
Outstanding Balance
$75,826
Interest Rate
6.3%
Mortgage Type
Unknown
Estimated Equity
$194,799
Purchase Details
Closed on
Feb 20, 2004
Sold by
Carter Carolyn J
Bought by
Bullard Lucille G
Purchase Details
Closed on
Oct 5, 2001
Sold by
Homes By Edd K Roberts Inc
Bought by
Carter Carolyn J
Home Financials for this Owner
Home Financials are based on the most recent Mortgage that was taken out on this home.
Original Mortgage
$115,100
Interest Rate
6.85%
Create a Home Valuation Report for This Property
The Home Valuation Report is an in-depth analysis detailing your home's value as well as a comparison with similar homes in the area
Home Values in the Area
Average Home Value in this Area
Purchase History
| Date | Buyer | Sale Price | Title Company |
|---|---|---|---|
| Baugh Molly Anne | $125,000 | None Available | |
| Bullard Lucille G | $125,000 | -- | |
| Carter Carolyn J | $128,000 | -- |
Source: Public Records
Mortgage History
| Date | Status | Borrower | Loan Amount |
|---|---|---|---|
| Open | Baugh Molly Anne | $125,000 | |
| Previous Owner | Carter Carolyn J | $115,100 |
Source: Public Records
Tax History Compared to Growth
Tax History
| Year | Tax Paid | Tax Assessment Tax Assessment Total Assessment is a certain percentage of the fair market value that is determined by local assessors to be the total taxable value of land and additions on the property. | Land | Improvement |
|---|---|---|---|---|
| 2025 | $2,146 | $243,814 | $50,000 | $193,814 |
| 2024 | $2,138 | $243,814 | $50,000 | $193,814 |
| 2023 | $1,721 | $156,015 | $22,000 | $134,015 |
| 2022 | $1,600 | $156,015 | $22,000 | $134,015 |
| 2021 | $1,538 | $156,015 | $22,000 | $134,015 |
| 2020 | $1,510 | $156,015 | $22,000 | $134,015 |
| 2019 | $1,456 | $123,899 | $22,000 | $101,899 |
| 2018 | $1,374 | $123,899 | $22,000 | $101,899 |
| 2017 | $1,309 | $123,899 | $22,000 | $101,899 |
| 2016 | $1,282 | $123,899 | $22,000 | $101,899 |
| 2015 | $1,257 | $119,433 | $22,000 | $97,433 |
| 2014 | $1,193 | $119,433 | $22,000 | $97,433 |
Source: Public Records
Map
Nearby Homes
- 2407 Trout Stream Dr
- 2304 Fields of Broadlands Dr
- 2527 Trout Stream Dr
- 3129 Skycrest Dr
- 2708 Clonnel Ct
- 2916 Bannf Ct
- 2209 Dobbin Place
- 2413 Trawick Rd
- 2848 W Jameson Rd
- 3455 Piedmont Dr
- Ellerbe Plan at Piedmont Point
- 2108 Carthage Cir
- 3109 E Folkestone Place
- 3421 E Jameson Rd
- 3603 Elm Grove Ln
- 3615 Elm Grove Ln
- 3613 Elm Grove Ln
- 3611 Elm Grove Ln
- 3605 Elm Grove Ln
- 3711 Elm Grove Ln
- 2523 Trout Stream Dr
- 2507 Trout Stream Dr Unit 6
- 2525 Trout Stream Dr Unit 3
- 2505 Trout Stream Dr
- 2503 Trout Stream Dr Unit 8
- 2404 Fields of Broadlands Dr
- 2529 Trout Stream Dr Unit 1
- 2408 Fields of Broadlands Dr
- 2501 Trout Stream Dr
- 2324 Fields of Broadlands Dr
- 2400 Fields of Broadlands Dr
- 2412 Fields of Broadlands Dr
- 2328 Fields of Broadlands Dr
- 2320 Fields of Broadlands Dr
- 3337 Neptune Dr
- 3341 Neptune Dr
- 3333 Neptune Dr
- 3345 Neptune Dr
- 2409 Trout Stream Dr
- 3329 Neptune Dr