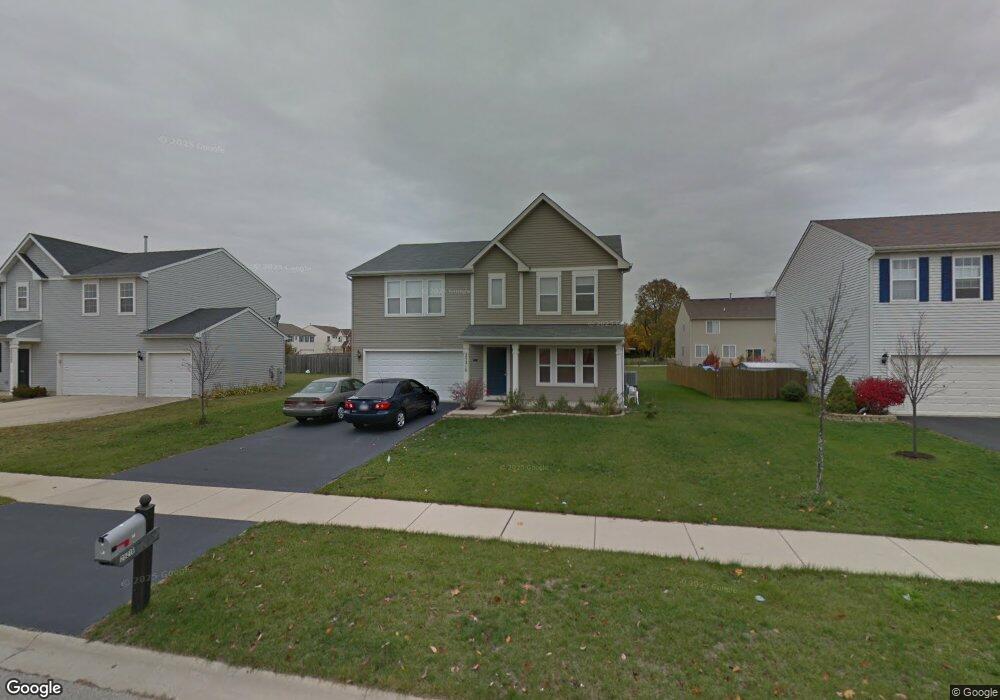
25216 Declaration Dr Plainfield, IL 60544
West Plainfield NeighborhoodEstimated Value: $421,495 - $480,000
3
Beds
3
Baths
2,428
Sq Ft
$188/Sq Ft
Est. Value
About This Home
This home is located at 25216 Declaration Dr, Plainfield, IL 60544 and is currently estimated at $456,624, approximately $188 per square foot. 25216 Declaration Dr is a home located in Will County with nearby schools including Lincoln Elementary School, Richard Ira Jones Middle School, and Plainfield North High School.
Ownership History
Date
Name
Owned For
Owner Type
Purchase Details
Closed on
Aug 20, 2007
Sold by
Steging Joshua L and Steging Ryann K
Bought by
Khan Mohammed V and Khan Shabana
Current Estimated Value
Home Financials for this Owner
Home Financials are based on the most recent Mortgage that was taken out on this home.
Original Mortgage
$176,600
Interest Rate
6.22%
Mortgage Type
Purchase Money Mortgage
Purchase Details
Closed on
Mar 12, 2007
Sold by
Nixon William T and Nixon Courtney T
Bought by
Steging Joshua L and Steging Ryann K
Home Financials for this Owner
Home Financials are based on the most recent Mortgage that was taken out on this home.
Original Mortgage
$235,600
Interest Rate
5.87%
Mortgage Type
Purchase Money Mortgage
Purchase Details
Closed on
Dec 22, 2005
Sold by
Drh Cambridge Homes Inc
Bought by
Nixon William T
Home Financials for this Owner
Home Financials are based on the most recent Mortgage that was taken out on this home.
Original Mortgage
$224,950
Interest Rate
5.37%
Mortgage Type
Fannie Mae Freddie Mac
Create a Home Valuation Report for This Property
The Home Valuation Report is an in-depth analysis detailing your home's value as well as a comparison with similar homes in the area
Home Values in the Area
Average Home Value in this Area
Purchase History
| Date | Buyer | Sale Price | Title Company |
|---|---|---|---|
| Khan Mohammed V | $224,000 | None Available | |
| Steging Joshua L | $248,000 | None Available | |
| Nixon William T | $237,000 | First American |
Source: Public Records
Mortgage History
| Date | Status | Borrower | Loan Amount |
|---|---|---|---|
| Previous Owner | Khan Mohammed V | $176,600 | |
| Previous Owner | Steging Joshua L | $235,600 | |
| Previous Owner | Nixon William T | $224,950 |
Source: Public Records
Tax History
| Year | Tax Paid | Tax Assessment Tax Assessment Total Assessment is a certain percentage of the fair market value that is determined by local assessors to be the total taxable value of land and additions on the property. | Land | Improvement |
|---|---|---|---|---|
| 2024 | $3,748 | $118,700 | $30,220 | $88,480 |
| 2023 | $3,748 | $107,207 | $27,294 | $79,913 |
| 2022 | $3,997 | $96,287 | $24,514 | $71,773 |
| 2021 | $4,597 | $89,988 | $22,910 | $67,078 |
| 2020 | $4,671 | $87,435 | $22,260 | $65,175 |
| 2019 | $4,743 | $83,311 | $21,210 | $62,101 |
| 2018 | $4,840 | $81,605 | $19,730 | $61,875 |
| 2017 | $4,952 | $77,549 | $18,749 | $58,800 |
| 2016 | $5,079 | $73,962 | $17,882 | $56,080 |
| 2015 | $5,351 | $69,285 | $16,751 | $52,534 |
| 2014 | $5,351 | $66,839 | $16,160 | $50,679 |
| 2013 | $5,351 | $66,839 | $16,160 | $50,679 |
Source: Public Records
Map
Nearby Homes
- 25138 Presidential Ave
- 14345 S Charlton Place
- 14343 S Charlton Place
- 14403 S Charlton Place
- 14341 S Charlton Place
- 14450 Independence Dr
- 25439 W Alabaster Cir
- 25445 W Alabaster Cir
- 25454 W Emory Ln
- 25500 W Emory Ln
- 25502 W Emory Ln
- 25504 W Alabaster Cir
- 25520 W Stockwell Dr
- 25504 W Emory Ln
- 25507 W Emory Ln
- 25506 W Alabaster Cir
- 25506 W Emory Ln
- 14561 S Greenbriar Dr
- 25522 W Emory Ln
- 25510 W Emory Ln
- 25210 Declaration Dr
- 25222 Declaration Dr
- 14402 Independence Dr
- 25204 Declaration Dr
- 14404 Independence Dr
- 14400 Independence Dr
- 25217 Declaration Dr
- 14406 Independence Dr
- 25221 Declaration Dr
- 25211 Declaration Dr
- 25142 Declaration Dr
- 25225 Declaration Dr
- 25205 Declaration Dr
- 14408 Independence Dr Unit 7
- 25302 Declaration Dr Unit 7
- 25119 Government Ln
- 25305 Declaration Dr
- 25136 Declaration Dr
- 25143 Declaration Dr
- 14410 Independence Dr
Your Personal Tour Guide
Ask me questions while you tour the home.