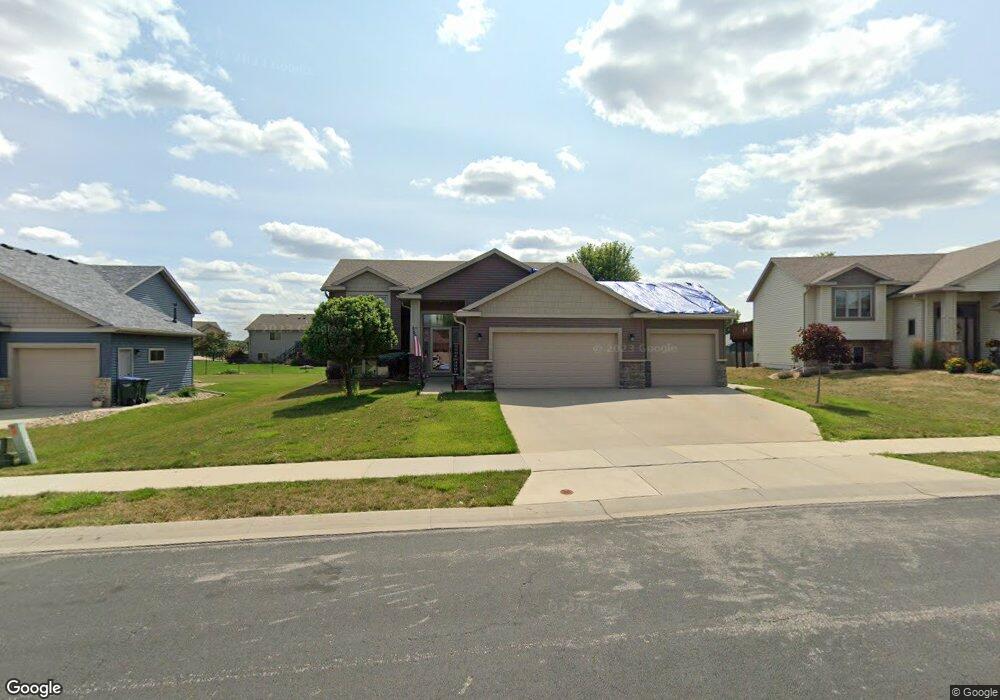
2523 Ashland Dr NW Rochester, MN 55901
Estimated Value: $420,608 - $447,000
4
Beds
3
Baths
1,234
Sq Ft
$354/Sq Ft
Est. Value
About This Home
This home is located at 2523 Ashland Dr NW, Rochester, MN 55901 and is currently estimated at $437,152, approximately $354 per square foot. 2523 Ashland Dr NW is a home located in Olmsted County with nearby schools including Sunset Terrace Elementary School, John Marshall Senior High School, and Holy Spirit Catholic School.
Ownership History
Date
Name
Owned For
Owner Type
Purchase Details
Closed on
May 17, 2010
Sold by
Castlewood Homes Inc
Bought by
Howard Jon C and Howard Sylwia M
Current Estimated Value
Home Financials for this Owner
Home Financials are based on the most recent Mortgage that was taken out on this home.
Original Mortgage
$234,837
Outstanding Balance
$157,016
Interest Rate
5%
Mortgage Type
FHA
Estimated Equity
$280,136
Purchase Details
Closed on
Oct 5, 2009
Sold by
Hoerle Donald H and Hoerle Mary Virginia
Bought by
Castlewood Homes Inc
Purchase Details
Closed on
Sep 16, 2008
Sold by
M W Johnson Construction Inc
Bought by
Hoerle Donald H
Home Financials for this Owner
Home Financials are based on the most recent Mortgage that was taken out on this home.
Original Mortgage
$140,000
Interest Rate
6.55%
Mortgage Type
Unknown
Create a Home Valuation Report for This Property
The Home Valuation Report is an in-depth analysis detailing your home's value as well as a comparison with similar homes in the area
Home Values in the Area
Average Home Value in this Area
Purchase History
| Date | Buyer | Sale Price | Title Company |
|---|---|---|---|
| Howard Jon C | $238,000 | Rochester Title & Escrow | |
| Castlewood Homes Inc | -- | None Available | |
| Hoerle Donald H | $175,000 | None Available |
Source: Public Records
Mortgage History
| Date | Status | Borrower | Loan Amount |
|---|---|---|---|
| Open | Howard Jon C | $234,837 | |
| Previous Owner | Hoerle Donald H | $140,000 |
Source: Public Records
Tax History Compared to Growth
Tax History
| Year | Tax Paid | Tax Assessment Tax Assessment Total Assessment is a certain percentage of the fair market value that is determined by local assessors to be the total taxable value of land and additions on the property. | Land | Improvement |
|---|---|---|---|---|
| 2024 | $4,938 | $364,400 | $60,000 | $304,400 |
| 2023 | $4,320 | $348,100 | $45,000 | $303,100 |
| 2022 | $3,966 | $342,500 | $45,000 | $297,500 |
| 2021 | $3,782 | $297,400 | $45,000 | $252,400 |
| 2020 | $3,884 | $284,500 | $45,000 | $239,500 |
| 2019 | $3,424 | $280,800 | $45,000 | $235,800 |
| 2018 | $3,274 | $251,900 | $40,000 | $211,900 |
| 2017 | $3,252 | $242,200 | $40,000 | $202,200 |
| 2016 | $2,906 | $220,300 | $37,300 | $183,000 |
| 2015 | $2,724 | $192,200 | $36,500 | $155,700 |
| 2014 | $2,648 | $192,200 | $36,500 | $155,700 |
| 2012 | -- | $190,000 | $36,451 | $153,549 |
Source: Public Records
Map
Nearby Homes
- 255x Heartland Dr NW
- 2757 Monroe Dr NW
- 2535 Superior Ln NW
- XXXX Valleyhigh Rd NW
- XXX 40th Ave NW
- 3615 Kenosha Dr NW
- The Jameson Plan at Badger Heights
- The Clifton II Plan at Badger Heights
- The Jordan Plan at Badger Heights
- The Whitney Plan at Badger Heights
- The Harmony Plan at Badger Heights
- The Adams II Plan at Badger Heights
- 4969 Noble Dr NW
- 3852 46th Ave NW
- 3740 8th St NW
- 3046 Jeremiah Ln NW
- 3415 7th St NW
- 2858 25th St NW
- 4339 Manor Park Dr NW
- 2804 25th St NW
- 2505 Ashland Dr NW
- 2545 Ashland Dr NW
- 4595 Tundra Ln NW
- 4603 Tundra Ln NW
- 4587 Tundra Ln NW
- 2483 Ashland Dr NW
- 2567 Ashland Dr NW
- 2528 Ashland Dr NW
- 4611 Tundra Ln NW
- 4575 Tundra Ln NW
- 2551 Heartland Dr NW
- 2504 Ashland Dr NW
- 2461 Ashland Dr NW
- 2573 Ashland Dr NW
- 4619 Tundra Ln NW
- 2480 Ashland Dr NW
- 4571 Tundra Ln NW
- 4600 Tundra Ln NW
- 2439 Ashland Dr NW
- 4584 Tundra Ln NW