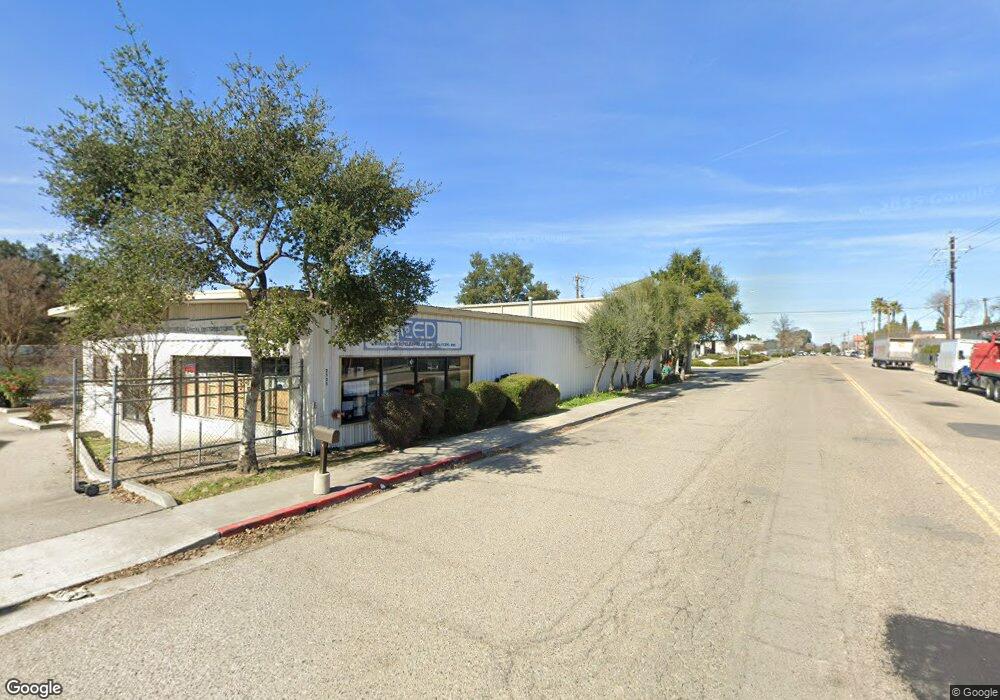
2525 Riverside Ave Paso Robles, CA 93446
Estimated Value: $1,305,503
2
Beds
1
Bath
6,840
Sq Ft
$191/Sq Ft
Est. Value
About This Home
This home is located at 2525 Riverside Ave, Paso Robles, CA 93446 and is currently estimated at $1,305,503, approximately $190 per square foot. 2525 Riverside Ave is a home located in San Luis Obispo County with nearby schools including Georgia Brown Dual Immersion Magnet Elementary School, George H. Flamson Middle School, and Paso Robles High School.
Ownership History
Date
Name
Owned For
Owner Type
Purchase Details
Closed on
Mar 25, 2025
Sold by
Lane Oreilly Revocable Trust and Oreilly Lane
Bought by
Rimfire Properties Llc
Current Estimated Value
Purchase Details
Closed on
Jun 4, 2024
Sold by
Oreilly Lane Anthony
Bought by
Lane Oreilly Revocable Trust and Oreilly
Purchase Details
Closed on
May 4, 2023
Sold by
Harris Family Properties Llc
Bought by
Oreilly Lane
Purchase Details
Closed on
Sep 21, 2015
Sold by
Thiessen James R and Thiessen Ernest H
Bought by
Harris Family Properties Llc
Purchase Details
Closed on
Mar 17, 1999
Sold by
Patel Prakash J and Patel Paresh J
Bought by
Akshar Partnership
Home Financials for this Owner
Home Financials are based on the most recent Mortgage that was taken out on this home.
Original Mortgage
$2,700,000
Interest Rate
6.73%
Mortgage Type
Construction
Create a Home Valuation Report for This Property
The Home Valuation Report is an in-depth analysis detailing your home's value as well as a comparison with similar homes in the area
Purchase History
| Date | Buyer | Sale Price | Title Company |
|---|---|---|---|
| Rimfire Properties Llc | -- | None Listed On Document | |
| Lane Oreilly Revocable Trust | -- | None Listed On Document | |
| Oreilly Lane | $1,220,000 | Fidelity National Title | |
| Harris Family Properties Llc | $805,000 | First American Title Company | |
| Akshar Partnership | -- | Fidelity National Title |
Source: Public Records
Mortgage History
| Date | Status | Borrower | Loan Amount |
|---|---|---|---|
| Previous Owner | Akshar Partnership | $2,700,000 |
Source: Public Records
Tax History
| Year | Tax Paid | Tax Assessment Tax Assessment Total Assessment is a certain percentage of the fair market value that is determined by local assessors to be the total taxable value of land and additions on the property. | Land | Improvement |
|---|---|---|---|---|
| 2025 | $13,835 | $1,269,288 | $494,190 | $775,098 |
| 2024 | $10,217 | $1,244,400 | $484,500 | $759,900 |
| 2023 | $10,217 | $915,947 | $324,278 | $591,669 |
| 2022 | $10,065 | $897,988 | $317,920 | $580,068 |
| 2021 | $9,894 | $880,382 | $311,687 | $568,695 |
| 2020 | $9,759 | $871,356 | $308,492 | $562,864 |
| 2019 | $9,621 | $854,272 | $302,444 | $551,828 |
| 2018 | $9,490 | $837,522 | $296,514 | $541,008 |
| 2017 | $8,923 | $821,100 | $290,700 | $530,400 |
| 2016 | $8,748 | $805,000 | $285,000 | $520,000 |
| 2015 | $5,948 | $541,171 | $48,044 | $493,127 |
| 2014 | $5,742 | $530,571 | $47,103 | $483,468 |
Source: Public Records
Map
Nearby Homes
- 2145 Park St
- 740 30th St
- 2221 Oak St
- 2237 Vine St
- 3121 Spring St Unit 106
- 1810 Park St
- 102 Glencrest Ln
- 1803 Pine St
- 2458 Altadena Ln
- 2757 Traditions Loop
- 2424 Traditions Loop
- 2425 Traditions Loop
- 2261 Almond Springs Dr
- 1545 Park St
- 2649 Clubhouse Dr
- 2642 Vineyard Cir
- 123 W 19th St
- 1446 Park St
- 204 18th St
- 1444 Oak St
- 2621 Riverside Ave
- 912 26th St
- 2631 Riverside Ave
- 2630 Riverside Ave
- 2780 Riverside Ave
- 0 - Unit CRNS25088501
- 0 Nacimiento Lake Unit NS25227175
- 2801 Riverside Ave
- 0 Mountain Ranch Unit NS20098168
- 736 26th St
- 2548 Spring St
- 26th Tractor St
- 727 26th St
- 2508 Spring St
- 2800 Riverside Ave
- 729 26th St
- 2626 Spring St
- 2248 Pine St Unit A1
- 715 24th St
- 715 24th St Unit DNV
Your Personal Tour Guide
Ask me questions while you tour the home.