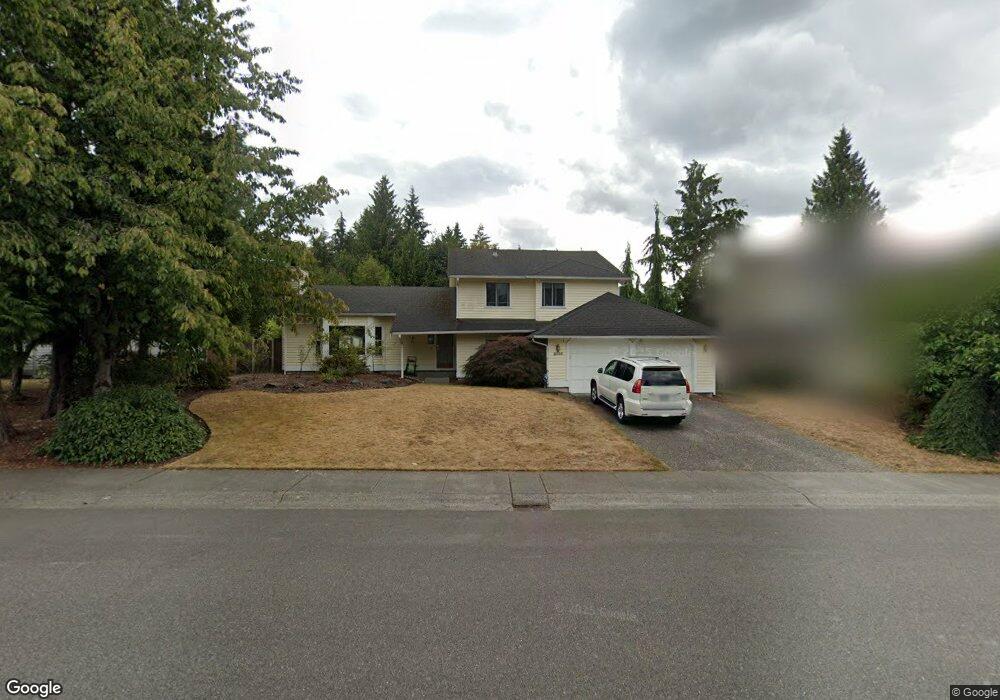
2526 184th Place SE Bothell, WA 98012
North Creek NeighborhoodEstimated Value: $787,933 - $1,021,000
4
Beds
3
Baths
2,073
Sq Ft
$440/Sq Ft
Est. Value
About This Home
This home is located at 2526 184th Place SE, Bothell, WA 98012 and is currently estimated at $911,233, approximately $439 per square foot. 2526 184th Place SE is a home located in Snohomish County with nearby schools including Crystal Springs Elementary School, Skyview Middle School, and North Creek High School.
Ownership History
Date
Name
Owned For
Owner Type
Purchase Details
Closed on
Jul 15, 2005
Sold by
Filimaua Ami
Bought by
Filimaua Robyn P and Peckoi Robyn
Current Estimated Value
Home Financials for this Owner
Home Financials are based on the most recent Mortgage that was taken out on this home.
Original Mortgage
$280,000
Outstanding Balance
$139,119
Interest Rate
5.51%
Mortgage Type
Fannie Mae Freddie Mac
Estimated Equity
$772,114
Purchase Details
Closed on
Jun 14, 2002
Sold by
Craig Jerry C and Craig Katrina S
Bought by
Peckol Robyn
Home Financials for this Owner
Home Financials are based on the most recent Mortgage that was taken out on this home.
Original Mortgage
$280,000
Interest Rate
6.23%
Purchase Details
Closed on
Nov 19, 1998
Sold by
Mclane Vance Wynn and Mclane Debra Kay
Bought by
Craig Jerry C and Craig Katrina S
Home Financials for this Owner
Home Financials are based on the most recent Mortgage that was taken out on this home.
Original Mortgage
$201,450
Interest Rate
8.75%
Create a Home Valuation Report for This Property
The Home Valuation Report is an in-depth analysis detailing your home's value as well as a comparison with similar homes in the area
Home Values in the Area
Average Home Value in this Area
Purchase History
| Date | Buyer | Sale Price | Title Company |
|---|---|---|---|
| Filimaua Robyn P | $56,179 | Ticor Title | |
| Peckol Robyn | $280,000 | First American | |
| Craig Jerry C | $237,000 | First American Title Co |
Source: Public Records
Mortgage History
| Date | Status | Borrower | Loan Amount |
|---|---|---|---|
| Open | Filimaua Robyn P | $280,000 | |
| Previous Owner | Peckol Robyn | $280,000 | |
| Previous Owner | Craig Jerry C | $201,450 |
Source: Public Records
Tax History
| Year | Tax Paid | Tax Assessment Tax Assessment Total Assessment is a certain percentage of the fair market value that is determined by local assessors to be the total taxable value of land and additions on the property. | Land | Improvement |
|---|---|---|---|---|
| 2026 | $7,749 | $966,200 | $691,000 | $275,200 |
| 2025 | $7,193 | $861,600 | $590,000 | $271,600 |
| 2024 | $7,193 | $799,600 | $537,000 | $262,600 |
| 2023 | $8,799 | $1,094,600 | $755,000 | $339,600 |
| 2022 | $7,655 | $756,500 | $470,000 | $286,500 |
| 2020 | $6,682 | $622,400 | $369,000 | $253,400 |
| 2019 | $5,948 | $560,000 | $315,000 | $245,000 |
| 2018 | $5,531 | $484,600 | $265,000 | $219,600 |
| 2017 | $4,732 | $421,300 | $215,000 | $206,300 |
| 2016 | $4,317 | $374,500 | $180,000 | $194,500 |
| 2015 | $4,300 | $354,500 | $170,000 | $184,500 |
| 2013 | $4,186 | $307,500 | $145,000 | $162,500 |
Source: Public Records
Map
Nearby Homes
- 18309 26th Dr SE
- 2401 185th Place SE
- 18501 28th Ave SE
- 18632 29th Ave SE
- 18429 20th Dr SE
- 3028 183rd Place SE
- 18223 31st Ave SE
- 18809 20th Dr SE
- 19218 26th Ave SE Unit 117
- 3205 179th Place SE
- 19102 20th Dr SE Unit B204
- 19102 20th Dr SE Unit B202
- 19102 20th Dr SE Unit B206
- 3125 194th St SE
- 18115 34th Dr SE
- 17529 Brook Blvd
- 3413 189th Place SE
- 18725 35th Dr SE
- 18910 Bothell Everett Hwy Unit H2
- 18910 Bothell Everett Hwy Unit N2
- 2516 184th Place SE
- 2532 184th Place SE
- 18523 26th Ave SE
- 18519 26th Ave SE
- 2510 184th Place SE
- 2600 184th Place SE
- 18332 26th Dr SE
- 2620 186th Place SE
- 18515 26th Ave SE
- 2523 184th Place SE
- 2515 184th Place SE
- 2502 184th Place SE
- 2608 184th Place SE
- 18511 26th Ave SE
- 2509 184th Place SE
- 18330 26th Dr SE
- 18531 26th Ave SE
- 2614 186th Place SE
- 18333 26th Dr SE
- 16412 (Lot 38) 1st Park SE
Your Personal Tour Guide
Ask me questions while you tour the home.