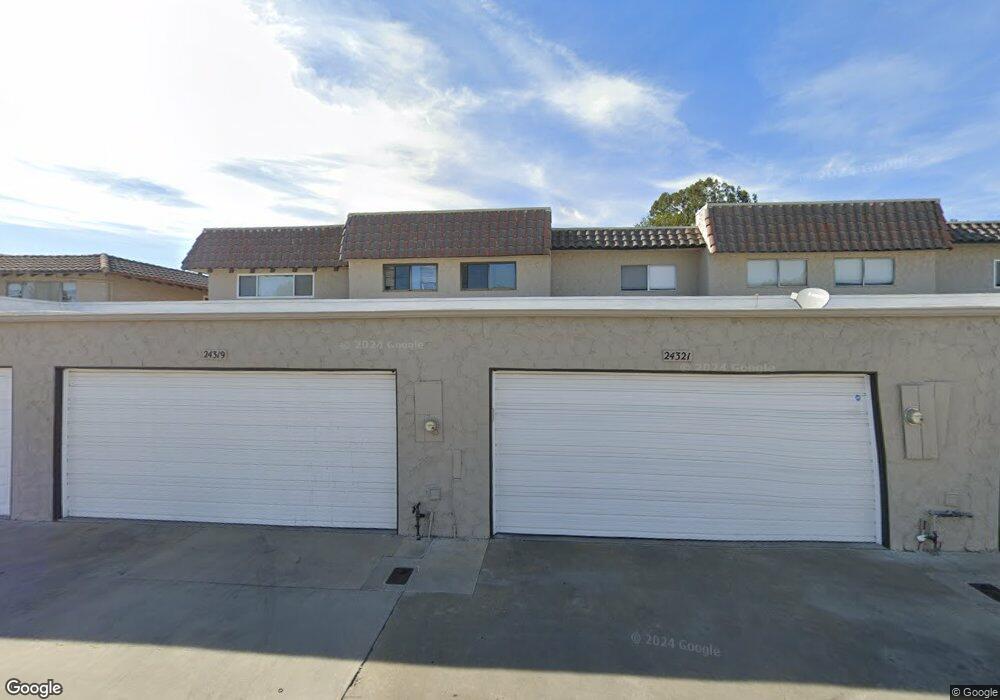
25268 Avenida Dorena Newhall, CA 91321
Estimated Value: $479,521 - $526,000
2
Beds
2
Baths
988
Sq Ft
$516/Sq Ft
Est. Value
About This Home
This home is located at 25268 Avenida Dorena, Newhall, CA 91321 and is currently estimated at $509,630, approximately $515 per square foot. 25268 Avenida Dorena is a home located in Los Angeles County with nearby schools including Wiley Canyon Elementary School, Placerita Junior High School, and William S. Hart High School.
Ownership History
Date
Name
Owned For
Owner Type
Purchase Details
Closed on
Aug 16, 2010
Sold by
Thomason Laura Anne
Bought by
Thomason Evan
Current Estimated Value
Purchase Details
Closed on
Jun 3, 2010
Sold by
Thomason Evan R and Thomason Evan Robert
Bought by
Thomason Laura Anne
Purchase Details
Closed on
Sep 30, 2004
Sold by
Thomason Laura A
Bought by
Thomason Evan R
Home Financials for this Owner
Home Financials are based on the most recent Mortgage that was taken out on this home.
Original Mortgage
$173,000
Outstanding Balance
$81,923
Interest Rate
5.12%
Mortgage Type
Purchase Money Mortgage
Estimated Equity
$427,707
Purchase Details
Closed on
Aug 30, 2000
Sold by
Decker Roger C
Bought by
Thomason Evan R and Thomason Laura A
Home Financials for this Owner
Home Financials are based on the most recent Mortgage that was taken out on this home.
Original Mortgage
$118,220
Interest Rate
7.98%
Create a Home Valuation Report for This Property
The Home Valuation Report is an in-depth analysis detailing your home's value as well as a comparison with similar homes in the area
Home Values in the Area
Average Home Value in this Area
Purchase History
| Date | Buyer | Sale Price | Title Company |
|---|---|---|---|
| Thomason Evan | -- | None Available | |
| Thomason Laura Anne | -- | None Available | |
| Thomason Evan R | -- | Fidelity National Title | |
| Thomason Evan R | $128,500 | Investors Title Company |
Source: Public Records
Mortgage History
| Date | Status | Borrower | Loan Amount |
|---|---|---|---|
| Open | Thomason Evan R | $173,000 | |
| Closed | Thomason Evan R | $118,220 |
Source: Public Records
Tax History Compared to Growth
Tax History
| Year | Tax Paid | Tax Assessment Tax Assessment Total Assessment is a certain percentage of the fair market value that is determined by local assessors to be the total taxable value of land and additions on the property. | Land | Improvement |
|---|---|---|---|---|
| 2025 | $3,243 | $211,380 | $83,270 | $128,110 |
| 2024 | $3,243 | $207,237 | $81,638 | $125,599 |
| 2023 | $3,138 | $203,175 | $80,038 | $123,137 |
| 2022 | $3,090 | $199,192 | $78,469 | $120,723 |
| 2021 | $3,029 | $195,287 | $76,931 | $118,356 |
| 2019 | $2,930 | $189,497 | $74,650 | $114,847 |
| 2018 | $2,837 | $185,783 | $73,187 | $112,596 |
| 2016 | $2,661 | $178,571 | $70,346 | $108,225 |
| 2015 | $2,605 | $175,890 | $69,290 | $106,600 |
| 2014 | $2,561 | $172,445 | $67,933 | $104,512 |
Source: Public Records
Map
Nearby Homes
- 25273 Avenida Dorena
- 25224 Avenida Dorena
- 24389 La Glorita Cir
- 25260 Avenida Dorena
- 24233 La Glorita Cir Unit 104
- 24373 La Glorita Cir
- 24302 Vista Ridge Dr
- 24441 Denise Place
- 24115 Evans Ave Unit 1
- 24716 Laurelcrest Ln
- 25010 Foxtail Ct
- 25000 Hawkbryn Ave Unit 88
- 25112 De Wolfe Rd
- 25252 Atwood Blvd
- 25019 Coriander Ct
- 421 Fourl Rd
- 24934 Old Wiley Canyon Rd
- 0 Chicory Ct
- 25208 Via Sistine
- 25221 Summerhill Ln
- 25272 Avenida Dorena
- 25274 Avenida Dorena
- 25276 Avenida Dorena
- 25278 Avenida Dorena Unit 7
- 25238 Avenida Dorena
- 25242 Avenida Dorena
- 25242 Avenida Dorena
- 25280 Avenida Dorena
- 25267 Avenida Dorena Unit 3
- 25265 Avenida Dorena Unit 2
- 25265 Avenida Dorena
- 25248 Avenida Dorena
- 25263 Avenida Dorena Unit 1
- 25263 Avenida Dorena
- 25282 Avenida Dorena Unit 9
- 25284 Avenida Dorena Unit 10
- 25284 Avenida Dorena
- 25234 Avenida Dorena
- 25254 Avenida Dorena
- 25288 Avenida Dorena