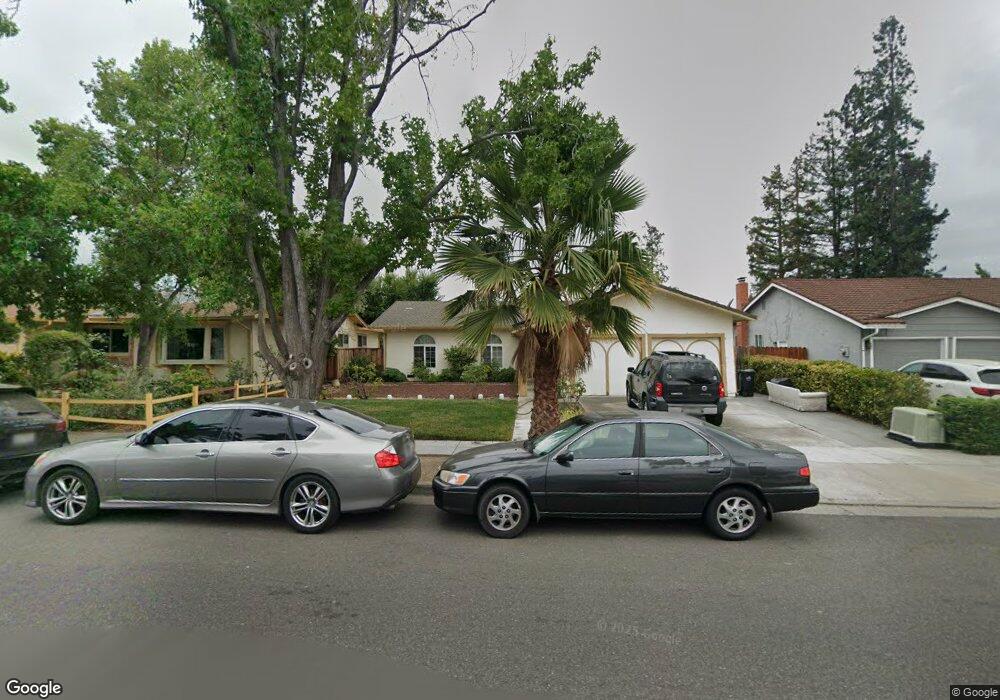
2527 Flint Ave San Jose, CA 95148
Norwood NeighborhoodEstimated Value: $1,297,855 - $1,521,000
3
Beds
2
Baths
1,532
Sq Ft
$928/Sq Ft
Est. Value
About This Home
This home is located at 2527 Flint Ave, San Jose, CA 95148 and is currently estimated at $1,422,214, approximately $928 per square foot. 2527 Flint Ave is a home located in Santa Clara County with nearby schools including Cedar Grove Elementary School, Quimby Oak Middle School, and Mt. Pleasant High School.
Ownership History
Date
Name
Owned For
Owner Type
Purchase Details
Closed on
Jun 22, 2024
Sold by
Alcantar Socorro
Bought by
Socorro Alcantar Living Trust and Alcantar
Current Estimated Value
Purchase Details
Closed on
Dec 11, 1996
Sold by
Alcantar Jesus Q and Alcantar Carmen Z
Bought by
Alcantar Socorro
Home Financials for this Owner
Home Financials are based on the most recent Mortgage that was taken out on this home.
Original Mortgage
$168,480
Interest Rate
8.13%
Create a Home Valuation Report for This Property
The Home Valuation Report is an in-depth analysis detailing your home's value as well as a comparison with similar homes in the area
Home Values in the Area
Average Home Value in this Area
Purchase History
| Date | Buyer | Sale Price | Title Company |
|---|---|---|---|
| Socorro Alcantar Living Trust | -- | None Listed On Document | |
| Alcantar Socorro | -- | Old Republic Title Company |
Source: Public Records
Mortgage History
| Date | Status | Borrower | Loan Amount |
|---|---|---|---|
| Previous Owner | Alcantar Socorro | $168,480 |
Source: Public Records
Tax History
| Year | Tax Paid | Tax Assessment Tax Assessment Total Assessment is a certain percentage of the fair market value that is determined by local assessors to be the total taxable value of land and additions on the property. | Land | Improvement |
|---|---|---|---|---|
| 2025 | $6,138 | $367,295 | $156,452 | $210,843 |
| 2024 | $6,138 | $360,094 | $153,385 | $206,709 |
| 2023 | $5,994 | $353,034 | $150,378 | $202,656 |
| 2022 | $5,958 | $346,113 | $147,430 | $198,683 |
| 2021 | $5,816 | $339,328 | $144,540 | $194,788 |
| 2020 | $5,553 | $335,849 | $143,058 | $192,791 |
| 2019 | $5,400 | $329,264 | $140,253 | $189,011 |
| 2018 | $5,319 | $322,808 | $137,503 | $185,305 |
| 2017 | $5,229 | $316,479 | $134,807 | $181,672 |
| 2016 | $4,985 | $310,274 | $132,164 | $178,110 |
| 2015 | $4,913 | $305,614 | $130,179 | $175,435 |
| 2014 | $4,368 | $299,628 | $127,629 | $171,999 |
Source: Public Records
Map
Nearby Homes
- 3410 Gila Dr
- 2571 Gumdrop Dr
- 2868 Ruby View
- 3455 Cuesta Dr
- 2363 Pleasant Acres Dr
- 2409 Klein Rd
- 2834 Rainwood Ct
- 3611 Groesbeck Hill Dr
- 2836 Broken Oak Ct
- 2808 Quest Ct
- 2030 Flintbury Ct
- 3623 Westview Dr
- 3633 Westview Dr
- 2955 Vineyard Park Dr
- 2646 Norcross Dr
- 3485 Rubion Ct
- 3561 Slopeview Dr
- 3165 Coldwater Dr
- 2945 Castleton Dr
- 3647 Lufkin Ct
Your Personal Tour Guide
Ask me questions while you tour the home.