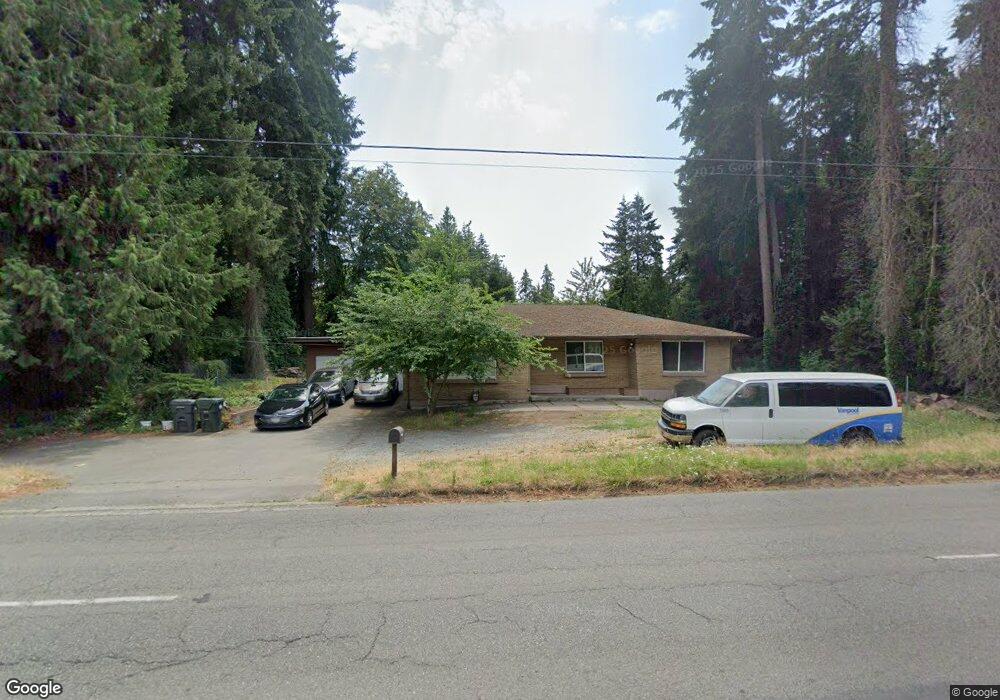
2528 72nd St E Tacoma, WA 98404
Waller NeighborhoodEstimated Value: $565,000 - $620,000
5
Beds
2
Baths
2,442
Sq Ft
$243/Sq Ft
Est. Value
About This Home
This home is located at 2528 72nd St E, Tacoma, WA 98404 and is currently estimated at $594,140, approximately $243 per square foot. 2528 72nd St E is a home located in Pierce County with nearby schools including Waller Road Elementary School, Aylen Junior High School, and Puyallup High School.
Ownership History
Date
Name
Owned For
Owner Type
Purchase Details
Closed on
Feb 23, 2021
Sold by
Do Duc H
Bought by
Liu Zhe Ying and Hua Cang Ngoc
Current Estimated Value
Home Financials for this Owner
Home Financials are based on the most recent Mortgage that was taken out on this home.
Original Mortgage
$405,000
Outstanding Balance
$363,054
Interest Rate
2.7%
Mortgage Type
New Conventional
Estimated Equity
$231,086
Purchase Details
Closed on
Sep 9, 2002
Sold by
Phung Phuong Thuc
Bought by
Do Duc Huu
Purchase Details
Closed on
Jul 12, 2001
Sold by
Midwest First Financial L P Iv
Bought by
Phung Phuong Thuc
Home Financials for this Owner
Home Financials are based on the most recent Mortgage that was taken out on this home.
Original Mortgage
$110,000
Interest Rate
7.21%
Purchase Details
Closed on
Feb 24, 1997
Sold by
South Saline
Bought by
Heng Sophan
Home Financials for this Owner
Home Financials are based on the most recent Mortgage that was taken out on this home.
Original Mortgage
$100,000
Interest Rate
10.75%
Create a Home Valuation Report for This Property
The Home Valuation Report is an in-depth analysis detailing your home's value as well as a comparison with similar homes in the area
Home Values in the Area
Average Home Value in this Area
Purchase History
| Date | Buyer | Sale Price | Title Company |
|---|---|---|---|
| Liu Zhe Ying | $450,000 | Ticor Title | |
| Do Duc Huu | $56,000 | -- | |
| Phung Phuong Thuc | $137,500 | -- | |
| Heng Sophan | -- | Chicago Title |
Source: Public Records
Mortgage History
| Date | Status | Borrower | Loan Amount |
|---|---|---|---|
| Open | Liu Zhe Ying | $405,000 | |
| Previous Owner | Phung Phuong Thuc | $110,000 | |
| Previous Owner | Heng Sophan | $100,000 |
Source: Public Records
Tax History Compared to Growth
Tax History
| Year | Tax Paid | Tax Assessment Tax Assessment Total Assessment is a certain percentage of the fair market value that is determined by local assessors to be the total taxable value of land and additions on the property. | Land | Improvement |
|---|---|---|---|---|
| 2025 | $5,778 | $595,600 | $198,800 | $396,800 |
| 2024 | $5,778 | $529,900 | $179,200 | $350,700 |
| 2023 | $5,778 | $496,600 | $170,700 | $325,900 |
| 2022 | $5,329 | $511,600 | $194,600 | $317,000 |
| 2021 | $4,982 | $375,400 | $136,600 | $238,800 |
| 2019 | $4,062 | $354,800 | $117,800 | $237,000 |
| 2018 | $4,954 | $317,600 | $93,600 | $224,000 |
| 2017 | $4,564 | $296,600 | $78,000 | $218,600 |
| 2016 | $4,242 | $220,600 | $59,300 | $161,300 |
| 2014 | $3,723 | $228,600 | $60,800 | $167,800 |
| 2013 | $3,723 | $203,900 | $55,400 | $148,500 |
Source: Public Records
Map
Nearby Homes
- 7410 25th Ave E
- 2112 E 68th St
- 7810 25th Ave E
- 6809 E Tonia St
- 2205 Sweet St
- 1902 72nd St E
- 2005 77th Street Ct E
- 1821 75th St E Unit 5
- 1706 73rd St E Unit 15
- 1735 E 65th St
- 13923 17th St E Unit 51
- 1721 E 65th St
- 7426 Portland Ave E
- 1720 80th St E
- 1727 E 64th St
- 7412 Vickery Ave E
- 8311 19th Avenue Ct E Unit 27
- 1311 E 68th St
- 1202 E 72nd St
- 8322 19th Avenue Ct E Unit 11
- 2447 E 72nd St
- 2605 72nd St E
- 2514 72nd St E
- 2437 E 72nd St
- 2504 72nd St E
- 7309 25th Ave E
- 7216 25th Ave E
- 2404 72nd St E
- 25th E Roosevelt Ave
- 7316 25th Ave E
- 2711 72nd St E
- 6897 E Grandview St
- 6891 E Grandview St
- 2320 72nd St E
- 6883 E Grandview St
- 7411 25th Ave E
- 6875 E Grandview St
- 6869 E Grandview St
- 6896 E Grandview St
- 7402 25th Ave E