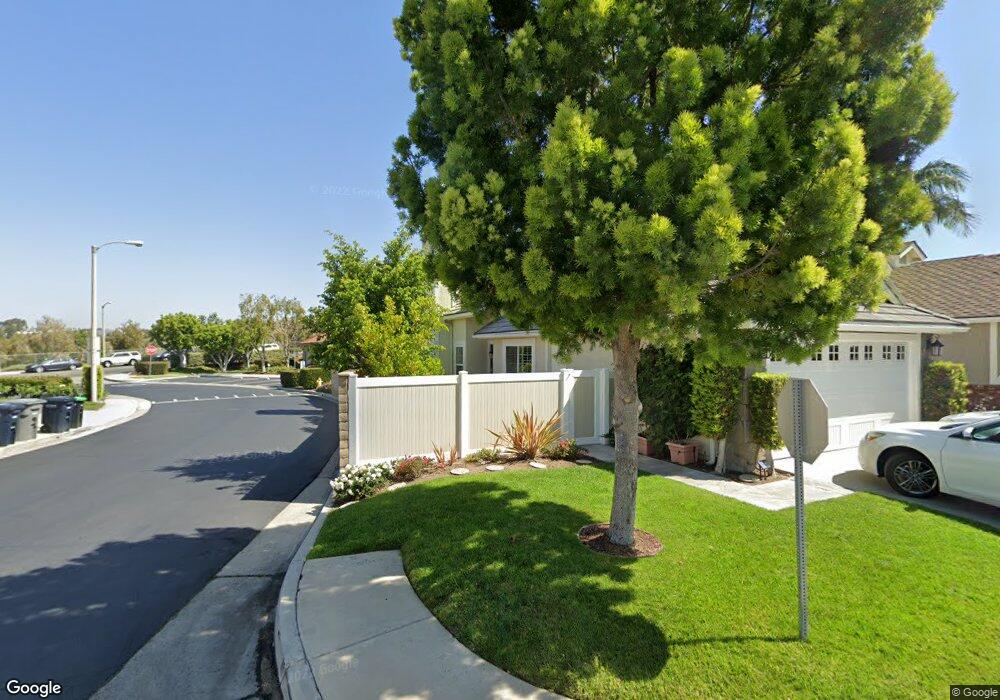
25291 New Haven Lake Forest, CA 92630
Estimated Value: $1,089,000 - $1,335,000
2
Beds
3
Baths
1,504
Sq Ft
$770/Sq Ft
Est. Value
About This Home
This home is located at 25291 New Haven, Lake Forest, CA 92630 and is currently estimated at $1,158,461, approximately $770 per square foot. 25291 New Haven is a home located in Orange County with nearby schools including Rancho Canada Elementary School, Serrano Intermediate School, and El Toro High School.
Ownership History
Date
Name
Owned For
Owner Type
Purchase Details
Closed on
Apr 24, 2024
Sold by
Curtis Michelle M
Bought by
Michelle M Curtis Living Trust and Curtis
Current Estimated Value
Purchase Details
Closed on
Jun 8, 1999
Sold by
Wan Yu Sang
Bought by
Curtis Michelle M
Home Financials for this Owner
Home Financials are based on the most recent Mortgage that was taken out on this home.
Original Mortgage
$220,450
Interest Rate
7.24%
Purchase Details
Closed on
Apr 2, 1997
Sold by
Leung Mona
Bought by
Yu Sang Wan
Home Financials for this Owner
Home Financials are based on the most recent Mortgage that was taken out on this home.
Original Mortgage
$136,000
Interest Rate
4.85%
Create a Home Valuation Report for This Property
The Home Valuation Report is an in-depth analysis detailing your home's value as well as a comparison with similar homes in the area
Home Values in the Area
Average Home Value in this Area
Purchase History
| Date | Buyer | Sale Price | Title Company |
|---|---|---|---|
| Michelle M Curtis Living Trust | -- | None Listed On Document | |
| Curtis Michelle M | $245,000 | Fidelity National Title Ins | |
| Yu Sang Wan | $170,000 | Stewart Title Company | |
| Leung Mona | -- | Stewart Title Company |
Source: Public Records
Mortgage History
| Date | Status | Borrower | Loan Amount |
|---|---|---|---|
| Previous Owner | Curtis Michelle M | $220,450 | |
| Previous Owner | Yu Sang Wan | $136,000 |
Source: Public Records
Tax History Compared to Growth
Tax History
| Year | Tax Paid | Tax Assessment Tax Assessment Total Assessment is a certain percentage of the fair market value that is determined by local assessors to be the total taxable value of land and additions on the property. | Land | Improvement |
|---|---|---|---|---|
| 2025 | $3,798 | $376,547 | $198,009 | $178,538 |
| 2024 | $3,798 | $369,164 | $194,126 | $175,038 |
| 2023 | $3,708 | $361,926 | $190,320 | $171,606 |
| 2022 | $3,640 | $354,830 | $186,588 | $168,242 |
| 2021 | $3,567 | $347,873 | $182,929 | $164,944 |
| 2020 | $3,534 | $344,306 | $181,053 | $163,253 |
| 2019 | $3,462 | $337,555 | $177,503 | $160,052 |
| 2018 | $3,396 | $330,937 | $174,023 | $156,914 |
| 2017 | $3,327 | $324,449 | $170,611 | $153,838 |
| 2016 | $3,271 | $318,088 | $167,266 | $150,822 |
| 2015 | $3,230 | $313,311 | $164,754 | $148,557 |
| 2014 | $3,159 | $307,174 | $161,527 | $145,647 |
Source: Public Records
Map
Nearby Homes
- 25225 Avenida Tranquila Unit 102
- 17 Ponte
- 25215 Avenida Pacifica Unit 44
- 25446 Yountville
- 27 Alessio
- 20981 Oakville Unit 35
- 25302 Vista Linda
- 25271 Baja Mar
- 21011 Marin Unit 103
- 12 Lontano
- 21231 Calle Sendero
- 639 Athos
- 21324 Balsam Ln
- 647 Pelion
- 25272 Birch Grove Ln
- 671 Pelion
- 174 Denali
- 168 Denali
- 21472 Firwood Unit 9
- 25162 Chestnutwood Unit 47
- 25301 New Haven
- 25305 New Haven
- 20095 Providence
- 25311 New Haven
- 21001 Providence
- 21032 Providence
- 21005 Providence
- 21036 Providence
- 25321 New Haven
- 21042 Providence
- 21011 Providence
- 21044 Providence
- 25325 New Haven
- 21015 Providence
- 21046 Providence
- 21021 Providence
- 25331 New Haven
- 21052 Providence
- 21015 Champlain
- 25335 New Haven