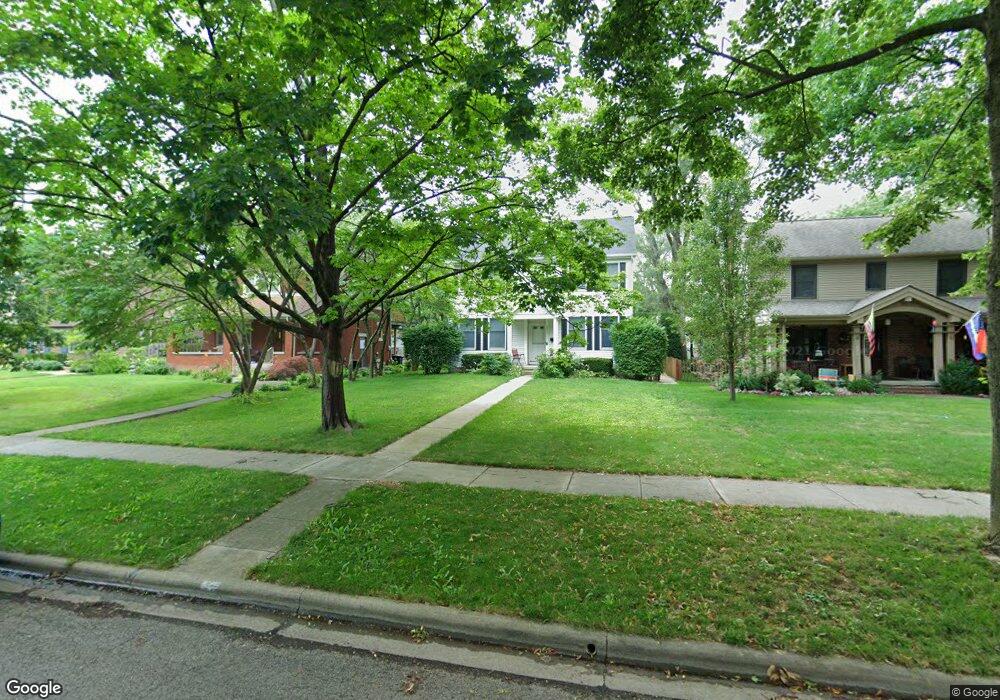
253 N Ardmore Rd Columbus, OH 43209
Estimated Value: $687,799 - $898,000
4
Beds
4
Baths
2,856
Sq Ft
$261/Sq Ft
Est. Value
About This Home
This home is located at 253 N Ardmore Rd, Columbus, OH 43209 and is currently estimated at $746,700, approximately $261 per square foot. 253 N Ardmore Rd is a home located in Franklin County with nearby schools including Maryland Elementary School, Bexley Middle School, and Bexley High School.
Ownership History
Date
Name
Owned For
Owner Type
Purchase Details
Closed on
Sep 23, 2000
Sold by
Smart J Howard and Smart Leslie D
Bought by
Levine Kevin and Levine Erika R
Current Estimated Value
Purchase Details
Closed on
Jun 22, 1999
Sold by
Walter Ira S and Walter Susan B
Bought by
Smart J Howard and Smart Leslie D
Home Financials for this Owner
Home Financials are based on the most recent Mortgage that was taken out on this home.
Original Mortgage
$224,000
Outstanding Balance
$60,246
Interest Rate
7.29%
Estimated Equity
$686,454
Purchase Details
Closed on
Mar 12, 1996
Sold by
Lavelle Properties & Bui
Bought by
Adler Ira S Walter and Adler Susan B
Home Financials for this Owner
Home Financials are based on the most recent Mortgage that was taken out on this home.
Original Mortgage
$195,000
Interest Rate
6.25%
Mortgage Type
New Conventional
Purchase Details
Closed on
Aug 16, 1994
Sold by
Unkefer Jack R
Bought by
Rgb Venture
Create a Home Valuation Report for This Property
The Home Valuation Report is an in-depth analysis detailing your home's value as well as a comparison with similar homes in the area
Home Values in the Area
Average Home Value in this Area
Purchase History
| Date | Buyer | Sale Price | Title Company |
|---|---|---|---|
| Levine Kevin | $300,000 | Benchmark Title Agency Inc | |
| Smart J Howard | $280,000 | Title First Agency Inc | |
| Adler Ira S Walter | $251,651 | -- | |
| Rgb Venture | $225,000 | -- |
Source: Public Records
Mortgage History
| Date | Status | Borrower | Loan Amount |
|---|---|---|---|
| Open | Smart J Howard | $224,000 | |
| Closed | Adler Ira S Walter | $195,000 |
Source: Public Records
Tax History Compared to Growth
Tax History
| Year | Tax Paid | Tax Assessment Tax Assessment Total Assessment is a certain percentage of the fair market value that is determined by local assessors to be the total taxable value of land and additions on the property. | Land | Improvement |
|---|---|---|---|---|
| 2024 | $10,709 | $192,850 | $61,740 | $131,110 |
| 2023 | $9,629 | $192,850 | $61,740 | $131,110 |
| 2022 | $10,777 | $173,360 | $42,910 | $130,450 |
| 2021 | $10,786 | $173,360 | $42,910 | $130,450 |
| 2020 | $10,691 | $173,360 | $42,910 | $130,450 |
| 2019 | $10,206 | $145,600 | $35,770 | $109,830 |
| 2018 | $8,904 | $145,600 | $35,770 | $109,830 |
| 2017 | $8,785 | $145,600 | $35,770 | $109,830 |
| 2016 | $8,915 | $137,060 | $24,780 | $112,280 |
| 2015 | $8,941 | $137,060 | $24,780 | $112,280 |
| 2014 | $8,992 | $137,060 | $24,780 | $112,280 |
| 2013 | $4,674 | $137,060 | $24,780 | $112,280 |
Source: Public Records
Map
Nearby Homes
- 170 N Cassingham Rd
- 538 Stanbery Ave
- 354 N Roosevelt Ave Unit 356
- 2629 E Broad St
- 696 Northview Ave
- 125 S Stanwood Rd
- 50 N Broadleigh Rd
- 2742 E 5th Ave
- 2822-2824 E 5th Ave
- 782 Northview Ave
- 440 N Nelson Rd
- 142 S Gould Rd
- 2996 E 6th Ave
- 797 N Nelson Rd
- 2167 Avalon Place Unit 169
- 2287 Margaret Ave Unit 289
- 3018 E 6th Ave Unit 20
- 799 Alton Ave
- 238 Edgevale Rd
- 0 E 7th Ave Unit Lot 79 225013171
- 261 N Ardmore Rd
- 247 N Ardmore Rd
- 267 N Ardmore Rd
- 241 N Ardmore Rd
- 241 N Ardmore Rd
- 275 N Ardmore Rd
- 235 N Ardmore Rd
- 235 N Ardmore Rd
- 260 N Cassady Ave
- 266 N Cassady Ave
- 252 N Cassady Ave
- 272 N Cassady Ave
- 246 N Cassady Ave
- 227 N Ardmore Rd
- 281 N Ardmore Rd
- 278 N Cassady Ave
- 248 N Ardmore Rd
- 238 N Cassady Ave
- 256 N Ardmore Rd
- 240 N Ardmore Rd