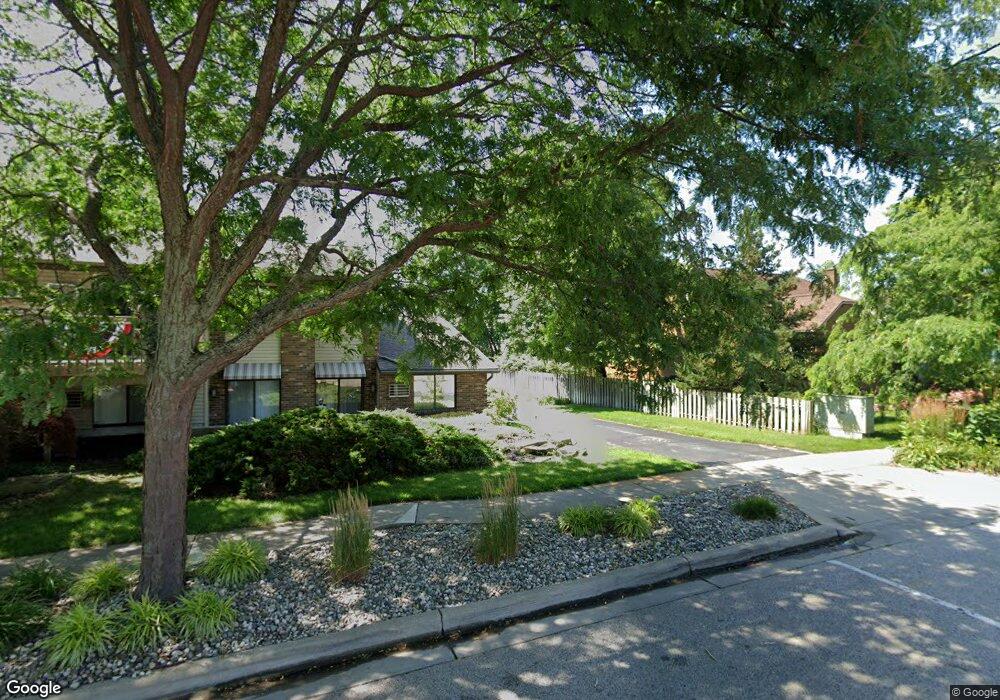
253 Riverfront St Spring Lake, MI 49456
Estimated Value: $444,114 - $583,000
3
Beds
2
Baths
1,394
Sq Ft
$375/Sq Ft
Est. Value
About This Home
This home is located at 253 Riverfront St, Spring Lake, MI 49456 and is currently estimated at $523,029, approximately $375 per square foot. 253 Riverfront St is a home located in Ottawa County with nearby schools including Spring Lake High School, West Michigan Academy of Arts & Academics, and St. Mary's School.
Ownership History
Date
Name
Owned For
Owner Type
Purchase Details
Closed on
May 12, 2025
Sold by
Yonker Randy Lee and Yonker Kristy Kay
Bought by
Yonker Trust and Yonker
Current Estimated Value
Purchase Details
Closed on
Jan 14, 2025
Sold by
Yonker Kristy K
Bought by
Yonker Randy L and Yonker Kristy K
Purchase Details
Closed on
Oct 9, 2024
Sold by
Yonker Kristy K
Bought by
Yonker Randy L and Yonker Kristy K
Purchase Details
Closed on
Oct 7, 2024
Sold by
Philip B Ruiter Trust and Yonker Kristy K
Bought by
Yonker Kristy K
Purchase Details
Closed on
Dec 28, 2023
Sold by
Ruiter Philip B
Bought by
Philip B Ruiter Trust and Ruiter
Purchase Details
Closed on
Aug 28, 2017
Sold by
Jennings Charles W and Jennings Carol A
Bought by
Ruiter Philip B and Ruiter Jacqueline A
Purchase Details
Closed on
Jan 15, 2015
Sold by
Jennings Charles W and Jennings Carol A
Bought by
Charles W Jennings Jr Trust
Create a Home Valuation Report for This Property
The Home Valuation Report is an in-depth analysis detailing your home's value as well as a comparison with similar homes in the area
Home Values in the Area
Average Home Value in this Area
Purchase History
| Date | Buyer | Sale Price | Title Company |
|---|---|---|---|
| Yonker Trust | -- | None Listed On Document | |
| Yonker Randy L | -- | None Listed On Document | |
| Yonker Randy L | -- | None Listed On Document | |
| Yonker Kristy K | -- | None Listed On Document | |
| Philip B Ruiter Trust | -- | None Listed On Document | |
| Ruiter Philip B | -- | None Available | |
| Charles W Jennings Jr Trust | -- | None Available |
Source: Public Records
Tax History
| Year | Tax Paid | Tax Assessment Tax Assessment Total Assessment is a certain percentage of the fair market value that is determined by local assessors to be the total taxable value of land and additions on the property. | Land | Improvement |
|---|---|---|---|---|
| 2025 | $7,099 | $175,000 | $0 | $0 |
| 2024 | $45 | $177,500 | $0 | $0 |
| 2023 | $4,249 | $160,900 | $0 | $0 |
| 2022 | $4,835 | $137,000 | $0 | $0 |
| 2021 | $4,671 | $131,800 | $0 | $0 |
| 2020 | $4,671 | $117,300 | $0 | $0 |
| 2019 | $4,611 | $112,900 | $0 | $0 |
| 2018 | $4,379 | $109,700 | $36,000 | $73,700 |
| 2017 | $4,038 | $104,700 | $0 | $0 |
| 2016 | $4,020 | $88,000 | $0 | $0 |
| 2015 | -- | $84,600 | $0 | $0 |
| 2014 | -- | $97,300 | $0 | $0 |
Source: Public Records
Map
Nearby Homes
- 221 Riverfront Dr Unit 12
- 223 E Savidge St
- 209 Rex St
- 409 South St
- 920 W Savidge St Unit 6
- 920 W Savidge St Unit 2
- 930 W Savidge St Unit 12
- 930 W Savidge St Unit 4
- 930 W Savidge St Unit 9
- 930 W Savidge St Unit 2
- 917 W Savidge St Unit 1
- 114 Millpoint Dr Unit 14
- 943 W Savidge St
- 522 River St
- 963 W Savidge St
- 965 W Savidge St
- 517 Pine St
- 601 Lakeview Ln Unit 1
- 618 Edgewater Dr Unit 5
- 606 Edgewater Ct
- 235 Riverfront St Unit 8
- 223 Riverfront St Unit 10
- 227 Riverfront St Unit 12
- 247 Riverfront St Unit 6
- 243 Riverfront St
- 233 Riverfront St
- 255 Riverfront St
- 245 Riverfront St
- 257 Riverfront St
- 253 Riverfront St Unit 1
- 233 Riverfront St Unit 7
- 247 Riverfront Dr Unit 6
- 245 Riverfront Dr Unit 5
- 225 Riverfront St
- 237 Riverfront St
- 237 Riverfront St Unit 9
- 221 Riverfront Dr Unit 4
- 221 Riverfront Dr Unit 10
- 221 Riverfront Dr Unit 8
- 218 W Exchange St
Your Personal Tour Guide
Ask me questions while you tour the home.