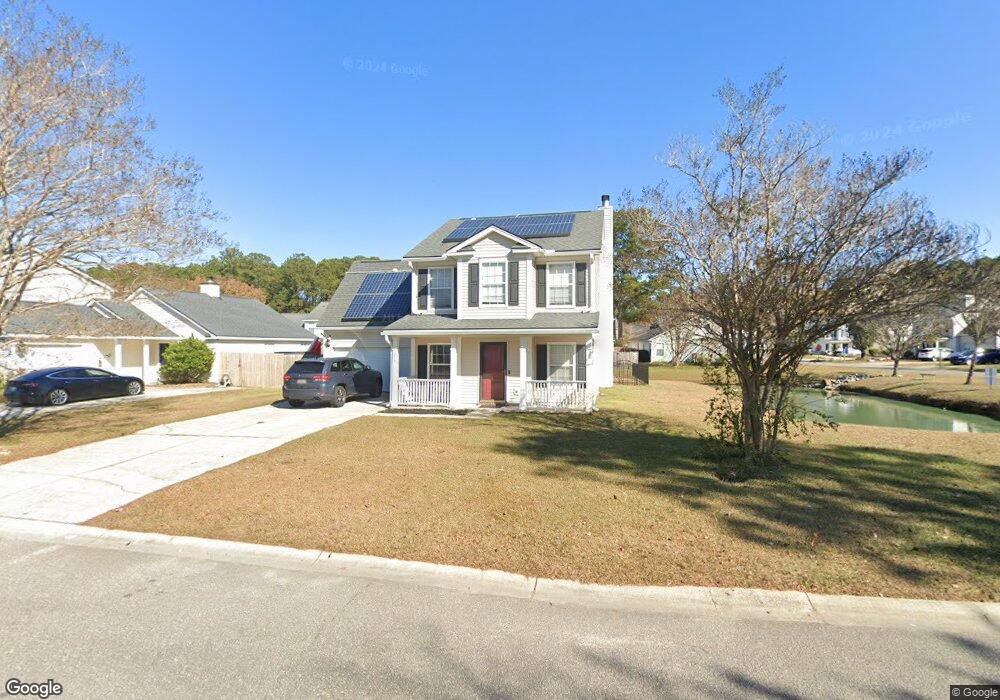
253 Two Pond Loop Ladson, SC 29456
Estimated Value: $303,000 - $370,000
4
Beds
3
Baths
1,779
Sq Ft
$189/Sq Ft
Est. Value
About This Home
This home is located at 253 Two Pond Loop, Ladson, SC 29456 and is currently estimated at $336,120, approximately $188 per square foot. 253 Two Pond Loop is a home located in Dorchester County with nearby schools including Joseph R. Pye Elementary, Oakbrook Middle School, and Ashley Ridge High School.
Ownership History
Date
Name
Owned For
Owner Type
Purchase Details
Closed on
Oct 22, 2015
Sold by
Warrior Joshua J
Bought by
Rowsey Rachel Elaine and Rowsey Rachel E
Current Estimated Value
Home Financials for this Owner
Home Financials are based on the most recent Mortgage that was taken out on this home.
Original Mortgage
$161,519
Outstanding Balance
$128,945
Interest Rate
4.4%
Mortgage Type
FHA
Estimated Equity
$207,175
Purchase Details
Closed on
Jul 3, 2013
Sold by
U S Bank National Association
Bought by
Warrior Joshua J
Home Financials for this Owner
Home Financials are based on the most recent Mortgage that was taken out on this home.
Original Mortgage
$102,419
Interest Rate
4%
Mortgage Type
Future Advance Clause Open End Mortgage
Purchase Details
Closed on
Jan 7, 2013
Sold by
Shiver James W and Shiver Marylin J
Bought by
U S Bank National Association
Purchase Details
Closed on
Jun 7, 2000
Sold by
Redding Shawn D
Bought by
Shiver James W and Shiver Marylin J
Create a Home Valuation Report for This Property
The Home Valuation Report is an in-depth analysis detailing your home's value as well as a comparison with similar homes in the area
Home Values in the Area
Average Home Value in this Area
Purchase History
| Date | Buyer | Sale Price | Title Company |
|---|---|---|---|
| Rowsey Rachel Elaine | $164,500 | -- | |
| Warrior Joshua J | $113,799 | -- | |
| U S Bank National Association | $90,000 | -- | |
| Shiver James W | $132,100 | -- |
Source: Public Records
Mortgage History
| Date | Status | Borrower | Loan Amount |
|---|---|---|---|
| Open | Rowsey Rachel Elaine | $161,519 | |
| Previous Owner | Warrior Joshua J | $102,419 |
Source: Public Records
Tax History
| Year | Tax Paid | Tax Assessment Tax Assessment Total Assessment is a certain percentage of the fair market value that is determined by local assessors to be the total taxable value of land and additions on the property. | Land | Improvement |
|---|---|---|---|---|
| 2025 | $2,190 | $13,060 | $4,560 | $8,500 |
| 2024 | $2,190 | $13,060 | $4,560 | $8,500 |
| 2023 | $2,190 | $8,450 | $1,600 | $6,850 |
| 2022 | $1,793 | $7,570 | $1,380 | $6,190 |
| 2021 | $1,889 | $7,570 | $1,380 | $6,190 |
| 2020 | $1,757 | $6,590 | $1,200 | $5,390 |
| 2019 | $1,716 | $6,590 | $1,200 | $5,390 |
| 2018 | $1,523 | $4,450 | $1,200 | $3,250 |
| 2017 | $1,493 | $4,450 | $1,200 | $3,250 |
| 2016 | $1,474 | $4,450 | $1,200 | $3,250 |
| 2015 | $1,059 | $4,450 | $1,200 | $3,250 |
| 2014 | $1,041 | $111,290 | $0 | $0 |
| 2013 | -- | $9,580 | $0 | $0 |
Source: Public Records
Map
Nearby Homes
- 120 Two Pond Loop
- 206 Limehouse Dr
- 224 Withers Ln
- 218 Withers Ln
- 9875 Jamison Rd
- 202 Elliott Dr
- 217 Beverly Dr
- 208 Terrace View Dr
- 9631 Crosscut Dr
- 9658 Jamison Rd
- 203 Terrace View Dr
- 117 Alwyn Blvd
- 111 Jarett Rd
- 1001 Margaret Dr
- 201 Ibis Dr
- 203 Ibis Dr
- 101 Wood Side Dr
- 52 Regency Oaks Dr
- 3857 Annapolis Way
- 91 Cross Timbers Dr
- 251 Two Pond Loop
- 247 Two Pond Loop
- 213 Two Pond Loop
- 215 Two Pond Loop
- 252 Two Pond Loop
- 211 Two Pond Loop
- 254 Two Pond Loop
- 250 Two Pond Loop
- 245 Two Pond Loop
- 217 Two Pond Loop
- 256 Two Pond Loop
- 248 Two Pond Loop
- 260 Two Pond Loop
- 262 Two Pond Loop
- 258 Two Pond Loop
- 264 Two Pond Loop
- 246 Two Pond Loop
- 266 Two Pond Loop
- 243 Two Pond Loop
- 221 Two Pond Loop
Your Personal Tour Guide
Ask me questions while you tour the home.