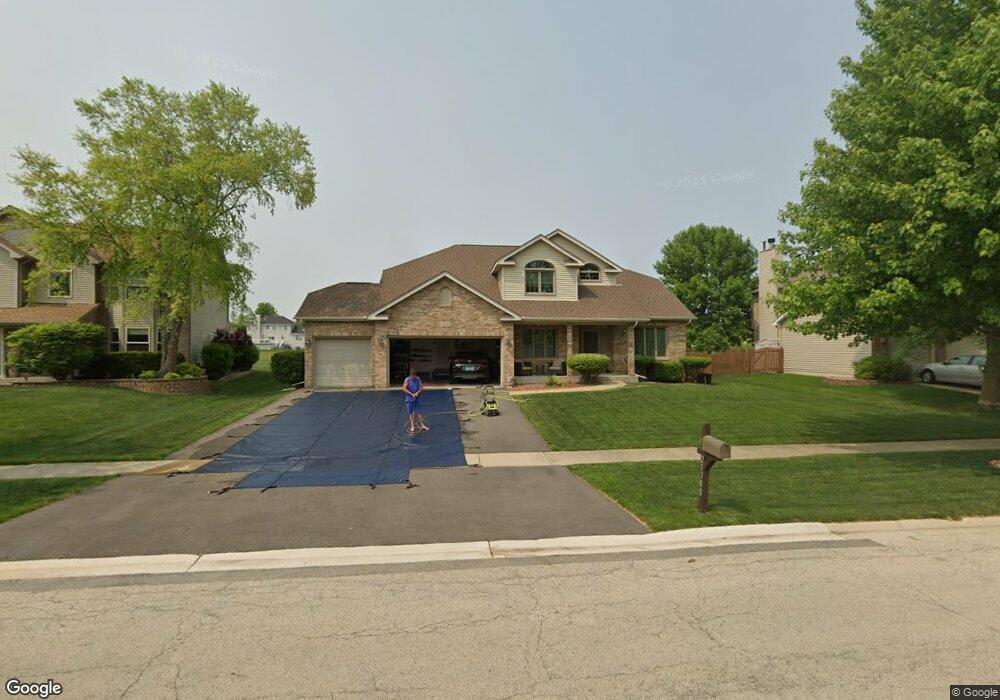
25300 Sunderlin Rd Plainfield, IL 60585
North Plainfield NeighborhoodEstimated Value: $492,000 - $591,000
--
Bed
1
Bath
2,526
Sq Ft
$211/Sq Ft
Est. Value
About This Home
This home is located at 25300 Sunderlin Rd, Plainfield, IL 60585 and is currently estimated at $534,215, approximately $211 per square foot. 25300 Sunderlin Rd is a home located in Will County with nearby schools including Walkers Grove Elementary School, Richard Ira Jones Middle School, and Plainfield North High School.
Ownership History
Date
Name
Owned For
Owner Type
Purchase Details
Closed on
Mar 22, 2000
Sold by
Monument Homes Inc
Bought by
Michalski Charles F and Michalski Dale A
Current Estimated Value
Home Financials for this Owner
Home Financials are based on the most recent Mortgage that was taken out on this home.
Original Mortgage
$182,300
Outstanding Balance
$62,228
Interest Rate
8.39%
Estimated Equity
$471,987
Purchase Details
Closed on
Nov 8, 1999
Sold by
First National Trust Company Natl Assn
Bought by
Monument Homes Inc
Home Financials for this Owner
Home Financials are based on the most recent Mortgage that was taken out on this home.
Original Mortgage
$190,000
Interest Rate
8.25%
Mortgage Type
Construction
Create a Home Valuation Report for This Property
The Home Valuation Report is an in-depth analysis detailing your home's value as well as a comparison with similar homes in the area
Home Values in the Area
Average Home Value in this Area
Purchase History
| Date | Buyer | Sale Price | Title Company |
|---|---|---|---|
| Michalski Charles F | $228,000 | Chicago Title Insurance Co | |
| Monument Homes Inc | $44,500 | Chicago Title Insurance Co |
Source: Public Records
Mortgage History
| Date | Status | Borrower | Loan Amount |
|---|---|---|---|
| Open | Michalski Charles F | $182,300 | |
| Previous Owner | Monument Homes Inc | $190,000 |
Source: Public Records
Tax History Compared to Growth
Tax History
| Year | Tax Paid | Tax Assessment Tax Assessment Total Assessment is a certain percentage of the fair market value that is determined by local assessors to be the total taxable value of land and additions on the property. | Land | Improvement |
|---|---|---|---|---|
| 2024 | $11,204 | $161,950 | $37,050 | $124,900 |
| 2023 | $11,204 | $143,066 | $32,730 | $110,336 |
| 2022 | $9,740 | $127,535 | $30,962 | $96,573 |
| 2021 | $9,380 | $121,462 | $29,488 | $91,974 |
| 2020 | $9,374 | $119,538 | $29,021 | $90,517 |
| 2019 | $9,232 | $116,169 | $28,203 | $87,966 |
| 2018 | $8,731 | $108,094 | $27,581 | $80,513 |
| 2017 | $8,685 | $105,303 | $26,869 | $78,434 |
| 2016 | $8,705 | $103,037 | $26,291 | $76,746 |
| 2015 | $8,192 | $99,074 | $25,280 | $73,794 |
| 2014 | $8,192 | $93,984 | $25,280 | $68,704 |
| 2013 | $8,192 | $93,984 | $25,280 | $68,704 |
Source: Public Records
Map
Nearby Homes
- 25255 Wheat Dr Unit 8
- 25463 Cinnamon Cir
- 25437 Blakely Dr
- 25205 Pastoral Dr
- 25216 Round Barn Rd Unit 11
- 25023 Round Barn Rd
- 12805 Tipperary Ln
- 25764 Sunnymere Dr
- 12906 S Sydney Cir
- 24528 W Alexis Ln
- 13018 S Sydney Cir
- 12717 Wexford Dr
- 25907 W Canyon Blvd
- 12955 S Sydney Cir
- 12946 S Sydney Cir
- 12942 S Sydney Cir
- 24708 W Owen Ct
- 24650 W Adalyn Ct
- 12854 S Sydney Cir
- 12938 S Beckham Dr
- 25258 Sunderlin Rd Unit 10
- 25308 Sunderlin Rd
- 25250 Sunderlin Rd
- 25316 Sunderlin Rd
- 25261 Sunderlin Rd
- 25313 Sunderlin Rd
- 25242 Sunderlin Rd
- 25251 Sunderlin Rd
- 25326 Sunderlin Rd
- 25243 Sunderlin Rd
- 25310 Wheat Dr Unit 8
- 25234 Sunderlin Rd
- 25304 Wheat Dr
- 25318 Wheat Dr
- 25260 Wheat Dr Unit 8
- 25328 Wheat Dr
- 13106 Sunderlin Rd
- 25235 Sunderlin Rd
- 25254 Wheat Dr
- 13114 Sunderlin Rd