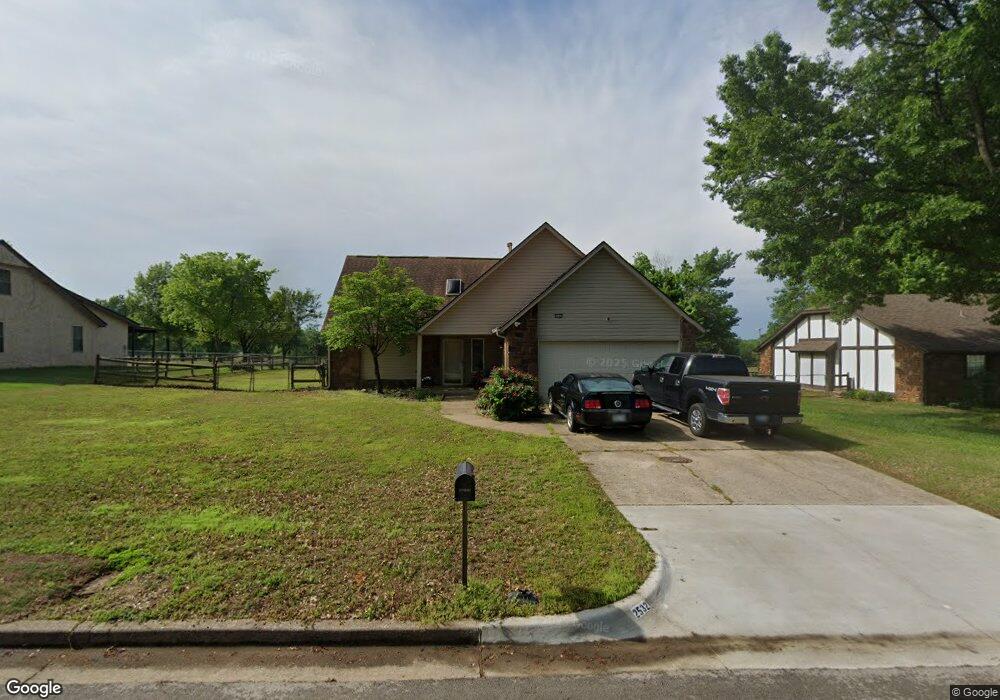
2532 W 68th Place S Tulsa, OK 74132
West Highlands-Tulsa Hills NeighborhoodEstimated Value: $287,000 - $315,000
4
Beds
2
Baths
2,187
Sq Ft
$139/Sq Ft
Est. Value
About This Home
This home is located at 2532 W 68th Place S, Tulsa, OK 74132 and is currently estimated at $304,213, approximately $139 per square foot. 2532 W 68th Place S is a home located in Tulsa County with nearby schools including Jenks Middle School, Jenks West Intermediate Elementary School, and Jenks High School.
Ownership History
Date
Name
Owned For
Owner Type
Purchase Details
Closed on
May 8, 2020
Sold by
Stewart Jesse and Stewart Katie
Bought by
Beamis Michael Scott and Beamis Mary Katherine
Current Estimated Value
Home Financials for this Owner
Home Financials are based on the most recent Mortgage that was taken out on this home.
Original Mortgage
$180,405
Outstanding Balance
$158,810
Interest Rate
3.3%
Mortgage Type
New Conventional
Estimated Equity
$145,403
Purchase Details
Closed on
Apr 10, 2017
Sold by
Presley Richard T
Bought by
Stewart Jesse and Stewart Katie
Home Financials for this Owner
Home Financials are based on the most recent Mortgage that was taken out on this home.
Original Mortgage
$173,627
Interest Rate
4.3%
Mortgage Type
FHA
Purchase Details
Closed on
Jun 14, 2000
Sold by
Biddick Michael J and Biddick Belinda Y
Bought by
Presley Richard T and Presley Patricia A
Purchase Details
Closed on
Nov 1, 1992
Create a Home Valuation Report for This Property
The Home Valuation Report is an in-depth analysis detailing your home's value as well as a comparison with similar homes in the area
Home Values in the Area
Average Home Value in this Area
Purchase History
| Date | Buyer | Sale Price | Title Company |
|---|---|---|---|
| Beamis Michael Scott | $190,000 | Firstitle & Abstract Service | |
| Stewart Jesse | $175,000 | None Available | |
| Presley Richard T | $127,500 | -- | |
| -- | $94,000 | -- |
Source: Public Records
Mortgage History
| Date | Status | Borrower | Loan Amount |
|---|---|---|---|
| Open | Beamis Michael Scott | $180,405 | |
| Previous Owner | Stewart Jesse | $173,627 |
Source: Public Records
Tax History Compared to Growth
Tax History
| Year | Tax Paid | Tax Assessment Tax Assessment Total Assessment is a certain percentage of the fair market value that is determined by local assessors to be the total taxable value of land and additions on the property. | Land | Improvement |
|---|---|---|---|---|
| 2025 | $3,421 | $24,194 | $2,442 | $21,752 |
| 2024 | $2,922 | $23,042 | $2,263 | $20,779 |
| 2023 | $2,922 | $21,945 | $2,382 | $19,563 |
| 2022 | $2,870 | $20,900 | $2,951 | $17,949 |
| 2021 | $2,909 | $20,900 | $2,951 | $17,949 |
| 2020 | $2,623 | $19,250 | $2,951 | $16,299 |
| 2019 | $2,712 | $19,250 | $2,951 | $16,299 |
| 2018 | $2,710 | $19,250 | $2,951 | $16,299 |
| 2017 | $2,011 | $15,626 | $2,755 | $12,871 |
| 2016 | $1,956 | $15,171 | $2,771 | $12,400 |
| 2015 | $1,930 | $15,479 | $2,827 | $12,652 |
| 2014 | $1,865 | $14,300 | $2,827 | $11,473 |
Source: Public Records
Map
Nearby Homes
- 6947 S 30th West Ave
- 3102 W 70th St
- 3026 W 68th Place S
- 3133 W 69th Place S
- 3121 W 69th Place S
- 2125 W 73rd St
- 6507 S 29th Place W
- 3290 W 71st St S
- 1942 W 65th St
- 2922 W 65th St S
- 2922 W 65th St
- 2917 W 65th St
- 7637 S 26th West Ave
- 3308 W 68th St S
- 1924 W 62nd St
- 6655 Riva Ridge Rd
- 7785 Forest Ln
- 6033 S 31st West Ave
- 6101 S 33rd West Ave
- 7778 Forest Ln
- 2532 W 68th Place
- 2526 W 68th Place
- 2602 W 68th Place
- 2527 W 68th Place
- 2533 W 68th Place
- 2520 W 68th Place
- 2605 W 68th Place S
- 2608 W 68th Place
- 2519 W 68th Place
- 2605 W 68th Place
- 2526 W 68th St
- 2520 W 68th St
- 2514 W 68th Place
- 2532 W 68th St
- 2611 W 68th Place
- 2514 W 68th St
- 2614 W 68th Place
- 2604 W 68th St
- 2617 W 68th Place S
- 2502 W 68th Place