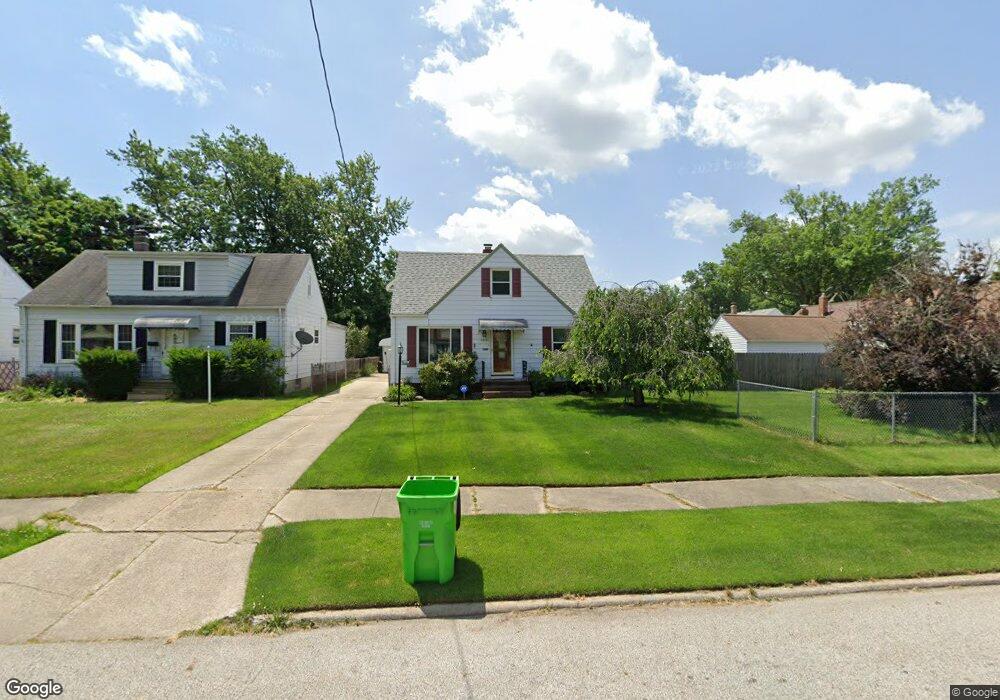
25350 Farringdon Ave Euclid, OH 44132
Estimated Value: $115,360 - $161,000
2
Beds
1
Bath
1,170
Sq Ft
$118/Sq Ft
Est. Value
About This Home
This home is located at 25350 Farringdon Ave, Euclid, OH 44132 and is currently estimated at $138,340, approximately $118 per square foot. 25350 Farringdon Ave is a home located in Cuyahoga County with nearby schools including Shoreview Elementary School, Euclid High School, and Pinnacle Academy.
Ownership History
Date
Name
Owned For
Owner Type
Purchase Details
Closed on
Jul 17, 2001
Sold by
Antonelli Robert A
Bought by
Blackman Eric A
Current Estimated Value
Home Financials for this Owner
Home Financials are based on the most recent Mortgage that was taken out on this home.
Original Mortgage
$88,511
Outstanding Balance
$34,308
Interest Rate
7.22%
Mortgage Type
FHA
Estimated Equity
$104,032
Purchase Details
Closed on
May 26, 1994
Sold by
Antonelli Robert A
Bought by
Antonelli Robert A
Purchase Details
Closed on
Dec 31, 1986
Sold by
Mary A Blanc
Bought by
Blanc Thomas
Purchase Details
Closed on
Mar 16, 1983
Sold by
Blanc Frank
Bought by
Mary A Blanc
Purchase Details
Closed on
Sep 11, 1979
Sold by
Blanc Frank and Blanc Mary
Bought by
Blanc Frank
Purchase Details
Closed on
Jan 1, 1975
Bought by
Blanc Frank and Blanc Mary
Create a Home Valuation Report for This Property
The Home Valuation Report is an in-depth analysis detailing your home's value as well as a comparison with similar homes in the area
Home Values in the Area
Average Home Value in this Area
Purchase History
| Date | Buyer | Sale Price | Title Company |
|---|---|---|---|
| Blackman Eric A | $89,900 | Reliance Title | |
| Antonelli Robert A | $23,000 | -- | |
| Antonelli Robert A | $23,000 | -- | |
| Blanc Thomas | -- | -- | |
| Mary A Blanc | -- | -- | |
| Blanc Frank | -- | -- | |
| Blanc Frank | -- | -- |
Source: Public Records
Mortgage History
| Date | Status | Borrower | Loan Amount |
|---|---|---|---|
| Open | Blackman Eric A | $88,511 |
Source: Public Records
Tax History Compared to Growth
Tax History
| Year | Tax Paid | Tax Assessment Tax Assessment Total Assessment is a certain percentage of the fair market value that is determined by local assessors to be the total taxable value of land and additions on the property. | Land | Improvement |
|---|---|---|---|---|
| 2024 | $2,961 | $42,875 | $8,785 | $34,090 |
| 2023 | $2,591 | $29,790 | $6,650 | $23,140 |
| 2022 | $2,533 | $29,790 | $6,650 | $23,140 |
| 2021 | $2,820 | $29,790 | $6,650 | $23,140 |
| 2020 | $2,676 | $25,690 | $5,740 | $19,950 |
| 2019 | $2,405 | $73,400 | $16,400 | $57,000 |
| 2018 | $2,395 | $25,690 | $5,740 | $19,950 |
| 2017 | $2,561 | $22,650 | $4,760 | $17,890 |
| 2016 | $2,566 | $22,650 | $4,760 | $17,890 |
| 2015 | $2,337 | $22,650 | $4,760 | $17,890 |
| 2014 | $2,337 | $22,650 | $4,760 | $17,890 |
Source: Public Records
Map
Nearby Homes
- 25450 Farringdon Ave
- 25401 Farringdon Ave
- 25671 Farringdon Ave
- 25390 Briardale Ave
- 25750 Drakefield Ave
- 25650 Shoreview Ave
- 25700 Briardale Ave
- 24850 Zeman Ave
- 24891 Zeman Ave
- 24850 Shoreview Ave
- 368 E 248th St
- 640 E 261st St
- 635 E 261st St
- 26171 Shoreview Ave
- 720 E 254th St
- 754 E 256th St
- 26351 Farringdon Ave
- 26430 Drakefield Ave
- 26230 Oriole Ave
- 321 E 243rd St
- 25400 Farringdon Ave
- 515 E 253rd St
- 521 E 253rd St
- 511 E 253rd St
- 525 E 253rd St
- 25351 Drakefield Ave
- 25371 Drakefield Ave
- 531 E 253rd St
- 25401 Drakefield Ave
- 495 E 253rd St
- 25500 Farringdon Ave
- 25451 Drakefield Ave
- 25351 Farringdon Ave
- 535 E 253rd St
- 25371 Farringdon Ave
- 491 E 253rd St
- 25501 Drakefield Ave
- 25520 Farringdon Ave
- 25451 Farringdon Ave
- 25521 Drakefield Ave