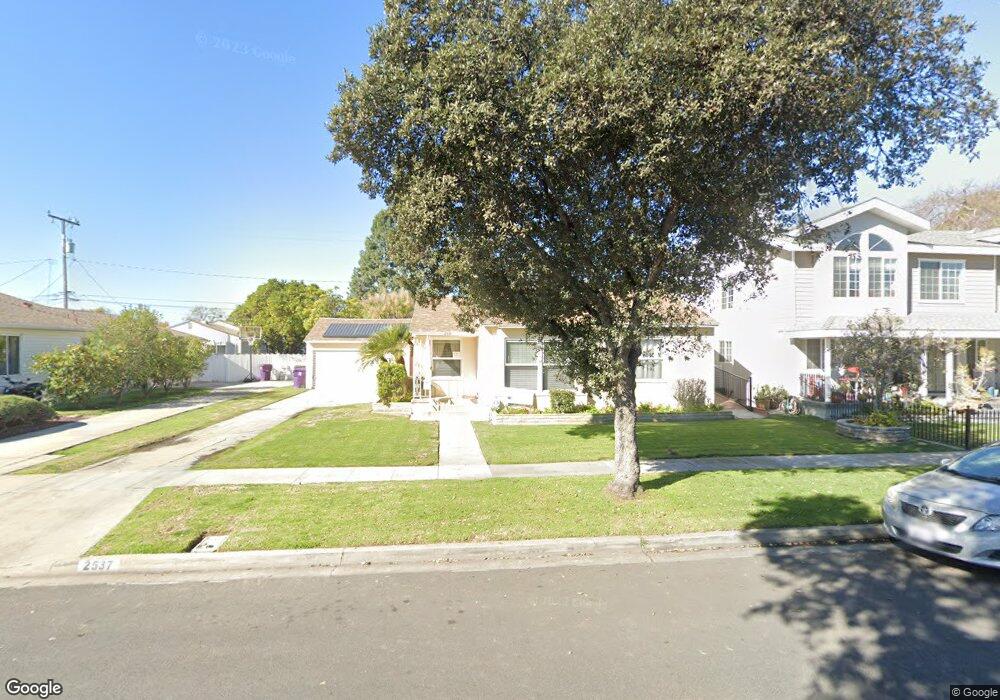
2537 Roycroft Ave Long Beach, CA 90815
Artcraft Manor NeighborhoodEstimated Value: $1,193,438
4
Beds
2
Baths
1,943
Sq Ft
$614/Sq Ft
Est. Value
About This Home
This home is located at 2537 Roycroft Ave, Long Beach, CA 90815 and is currently estimated at $1,193,438, approximately $614 per square foot. 2537 Roycroft Ave is a home located in Los Angeles County with nearby schools including Bixby Elementary School, Stanford Middle School, and Woodrow Wilson High School.
Ownership History
Date
Name
Owned For
Owner Type
Purchase Details
Closed on
Apr 24, 2014
Sold by
Zimmermann Dominique
Bought by
Zimmermann Christian Werner
Current Estimated Value
Purchase Details
Closed on
Apr 2, 2014
Sold by
Zimmermann Christian Werner
Bought by
Bz Services Llc
Purchase Details
Closed on
Dec 10, 2007
Sold by
Zimmermann Christian W
Bought by
Bz Services Llc
Purchase Details
Closed on
Sep 17, 2002
Sold by
Stubbs Patricia A
Bought by
Zimmermann Christian W
Home Financials for this Owner
Home Financials are based on the most recent Mortgage that was taken out on this home.
Original Mortgage
$309,200
Interest Rate
6.75%
Mortgage Type
Commercial
Purchase Details
Closed on
Jan 16, 1995
Sold by
Stubbs Patricia A and Hertzfeldt Patricia Ann
Bought by
Stubbs Patricia A and Stubbs Trust
Create a Home Valuation Report for This Property
The Home Valuation Report is an in-depth analysis detailing your home's value as well as a comparison with similar homes in the area
Home Values in the Area
Average Home Value in this Area
Purchase History
| Date | Buyer | Sale Price | Title Company |
|---|---|---|---|
| Zimmermann Christian Werner | -- | None Available | |
| Zimmermann Christian Werner | -- | None Available | |
| Bz Services Llc | -- | Accommodation | |
| Bz Services Llc | -- | None Available | |
| Zimmermann Christian W | $386,500 | -- | |
| Stubbs Patricia A | -- | -- |
Source: Public Records
Mortgage History
| Date | Status | Borrower | Loan Amount |
|---|---|---|---|
| Previous Owner | Zimmermann Christian W | $309,200 | |
| Closed | Zimmermann Christian W | $77,300 |
Source: Public Records
Tax History
| Year | Tax Paid | Tax Assessment Tax Assessment Total Assessment is a certain percentage of the fair market value that is determined by local assessors to be the total taxable value of land and additions on the property. | Land | Improvement |
|---|---|---|---|---|
| 2025 | $7,962 | $611,129 | $447,813 | $163,316 |
| 2024 | $7,962 | $599,147 | $439,033 | $160,114 |
| 2023 | $7,831 | $587,400 | $430,425 | $156,975 |
| 2022 | $7,354 | $575,884 | $421,986 | $153,898 |
| 2021 | $7,205 | $564,593 | $413,712 | $150,881 |
| 2019 | $7,102 | $547,848 | $401,442 | $146,406 |
| 2018 | $6,856 | $537,107 | $393,571 | $143,536 |
| 2016 | $6,298 | $516,252 | $378,289 | $137,963 |
| 2015 | $5,968 | $508,498 | $372,607 | $135,891 |
| 2014 | $5,919 | $498,539 | $365,309 | $133,230 |
Source: Public Records
Map
Nearby Homes
- 2400 Quincy Ave
- 2510 Termino Ave
- 2425 Heather Ave
- 2731 Stanbridge Ave
- 2120 Clark Ave
- 3950 E De Ora Way
- 2155 Euclid Ave
- 2151 Euclid Ave
- 4201 E Jacinto Way
- 2039 Rutgers Ave
- 2248 Montair Ave
- 2616 Foreman Ave
- 3408 Hathaway Ave
- 3464 Hathaway Ave Unit 335
- 3488 Hathaway Ave
- 5203 E Abbeyfield St
- 5036 E Atherton St Unit 26
- 1655 Clark Ave Unit 124
- 5110 E Atherton St Unit 62
- 5430 E Scrivener St
- 2525 Roycroft Ave
- 2545 Roycroft Ave
- 2538 Quincy Ave Unit A
- 2538 Quincy Ave
- 2548 Quincy Ave
- 2528 Quincy Ave
- 2515 Roycroft Ave
- 2540 Roycroft Ave
- 2516 Quincy Ave
- 2530 Roycroft Ave
- 2501 Roycroft Ave
- 2520 Roycroft Ave
- 2500 Quincy Ave
- 4790 E Vernon St
- 2470 Roycroft Ave
- 2537 Quincy Ave
- 2445 Roycroft Ave
- 2511 Park Ave
- 2525 Quincy Ave
- 2545 Quincy Ave
Your Personal Tour Guide
Ask me questions while you tour the home.