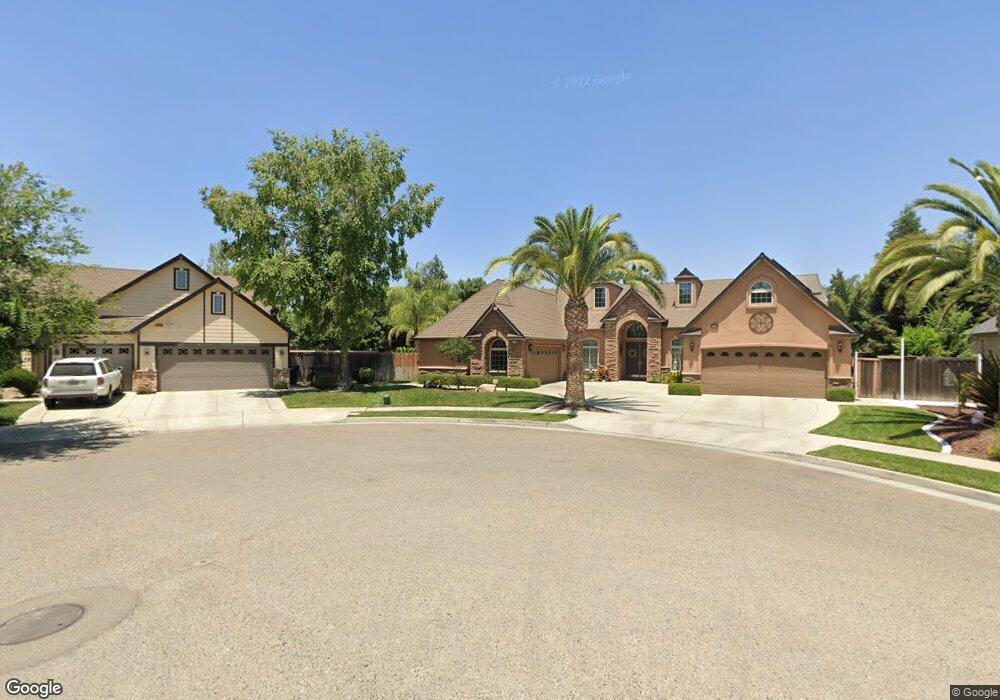
2538 La Paloma Dr Tulare, CA 93274
Northeast Tulare NeighborhoodEstimated Value: $596,000 - $767,000
4
Beds
4
Baths
3,323
Sq Ft
$213/Sq Ft
Est. Value
About This Home
This home is located at 2538 La Paloma Dr, Tulare, CA 93274 and is currently estimated at $709,400, approximately $213 per square foot. 2538 La Paloma Dr is a home located in Tulare County with nearby schools including Mission Valley Elementary School, Live Oak Middle School, and Tulare Union High School.
Ownership History
Date
Name
Owned For
Owner Type
Purchase Details
Closed on
Feb 2, 2021
Sold by
Martin Ramon
Bought by
Martin Luz Angelica
Current Estimated Value
Purchase Details
Closed on
Sep 10, 2020
Sold by
Oropeza Blanca J
Bought by
Martin Luz Angelica
Home Financials for this Owner
Home Financials are based on the most recent Mortgage that was taken out on this home.
Original Mortgage
$350,000
Interest Rate
2.6%
Mortgage Type
New Conventional
Purchase Details
Closed on
Sep 11, 2007
Sold by
Lennar Fresno Inc
Bought by
Oropeza Blanca J
Home Financials for this Owner
Home Financials are based on the most recent Mortgage that was taken out on this home.
Original Mortgage
$359,800
Interest Rate
6.35%
Mortgage Type
Negative Amortization
Purchase Details
Closed on
Jan 17, 2007
Sold by
Gmac Model Home Finance Llc
Bought by
Lennar Fresno Inc
Create a Home Valuation Report for This Property
The Home Valuation Report is an in-depth analysis detailing your home's value as well as a comparison with similar homes in the area
Home Values in the Area
Average Home Value in this Area
Purchase History
| Date | Buyer | Sale Price | Title Company |
|---|---|---|---|
| Martin Luz Angelica | -- | First American Title | |
| Martin Luz Angelica | $600,000 | First American Title | |
| Oropeza Blanca J | $514,000 | North American Title Co | |
| Lennar Fresno Inc | -- | North American Title |
Source: Public Records
Mortgage History
| Date | Status | Borrower | Loan Amount |
|---|---|---|---|
| Previous Owner | Martin Luz Angelica | $350,000 | |
| Previous Owner | Oropeza Blanca J | $359,800 |
Source: Public Records
Tax History Compared to Growth
Tax History
| Year | Tax Paid | Tax Assessment Tax Assessment Total Assessment is a certain percentage of the fair market value that is determined by local assessors to be the total taxable value of land and additions on the property. | Land | Improvement |
|---|---|---|---|---|
| 2025 | $7,405 | $649,457 | $162,364 | $487,093 |
| 2024 | $7,405 | $636,724 | $159,181 | $477,543 |
| 2023 | $7,225 | $624,240 | $156,060 | $468,180 |
| 2022 | $7,024 | $612,000 | $153,000 | $459,000 |
| 2021 | $6,130 | $528,000 | $132,000 | $396,000 |
| 2020 | $5,737 | $481,000 | $120,000 | $361,000 |
| 2019 | $5,463 | $441,000 | $110,000 | $331,000 |
| 2018 | $5,289 | $429,000 | $107,000 | $322,000 |
| 2017 | $4,857 | $389,000 | $97,000 | $292,000 |
| 2016 | $5,093 | $419,000 | $105,000 | $314,000 |
| 2015 | $4,547 | $372,000 | $93,000 | $279,000 |
| 2014 | $4,547 | $372,000 | $93,000 | $279,000 |
Source: Public Records
Map
Nearby Homes
- 2531 Tempranillo Dr
- 1618 Glen Ellen Ct
- 2106 Albarino Ct
- 2673 Clarete St
- 3039 Britannia St
- 1926 Amarone Ave
- 3185 Dorset St
- 2152 Roussanne Ave Unit Sor34
- 0 E Cartmill Ave
- 0 Cartmill Ave Unit 202574
- Lot 61 St
- Lot 52 2875 Dorset St
- 3096 Markham St
- Lot 37 2850 Dorset St
- 2826 Dorset St Unit Sor35
- 2863 Dorset St Unit Sor53
- 2850 Dorset St Unit Sor37
- 2875 Dorset St Unit Sor52
- 2889 Dorset St Unit Sor51
- 1249 Bargetto Ct
- 2530 La Paloma Dr
- 2546 La Paloma Ct
- 2522 La Paloma Dr
- 2567 Tempranillo Dr
- 2579 Tempranillo Dr
- 2555 Tempranillo Dr
- 2555 La Paloma Dr
- 2543 Tempranillo Dr
- 2659 Gorelli Ct
- 2514 La Paloma Dr
- 2539 Tempranillo Dr
- 2519 La Paloma Dr
- 2518 Dover Canyon Place
- 2672 Gorelli Ct
- 2661 Gorelli Ct
- 2515 Dover Canyon Place
- 1543 Clarete Ave
- 2511 La Paloma Dr
- 2668 Korbel Ct
- 2506 La Paloma Dr