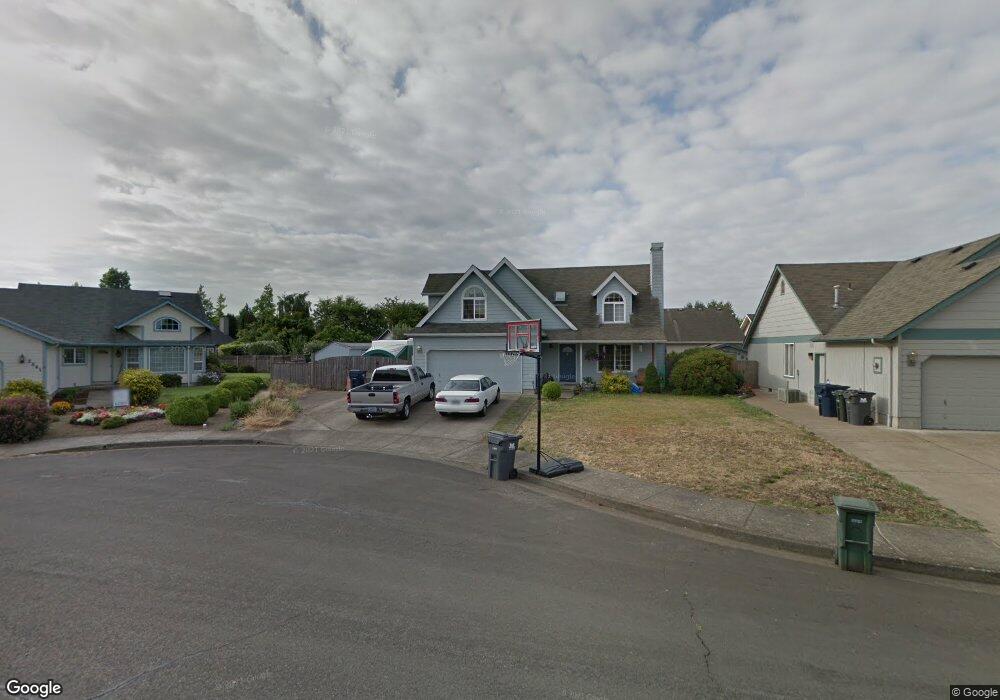
2539 Cubit St Eugene, OR 97402
Bethel NeighborhoodEstimated Value: $438,000 - $514,000
3
Beds
4
Baths
1,710
Sq Ft
$273/Sq Ft
Est. Value
About This Home
This home is located at 2539 Cubit St, Eugene, OR 97402 and is currently estimated at $467,245, approximately $273 per square foot. 2539 Cubit St is a home located in Lane County with nearby schools including Malabon Elementary School, Cascade Middle School, and Willamette High School.
Ownership History
Date
Name
Owned For
Owner Type
Purchase Details
Closed on
Sep 23, 2013
Sold by
English Ross Rebecca and Ross Dennis L
Bought by
Stevenson Shawn and Stevenson Stacy
Current Estimated Value
Home Financials for this Owner
Home Financials are based on the most recent Mortgage that was taken out on this home.
Original Mortgage
$198,550
Outstanding Balance
$147,615
Interest Rate
4.46%
Mortgage Type
New Conventional
Estimated Equity
$319,630
Purchase Details
Closed on
Sep 3, 2004
Sold by
Cunningham John A and Cunningham Kimberly R
Bought by
English Ross Rebecca and Ross Dennis L
Home Financials for this Owner
Home Financials are based on the most recent Mortgage that was taken out on this home.
Original Mortgage
$159,920
Interest Rate
6.06%
Mortgage Type
Purchase Money Mortgage
Purchase Details
Closed on
Jul 2, 2001
Sold by
Mickel Ardyce K and Harvey Ardyce K
Bought by
Cunningham John A and Cunningham Kimberly R
Home Financials for this Owner
Home Financials are based on the most recent Mortgage that was taken out on this home.
Original Mortgage
$159,550
Interest Rate
7.24%
Create a Home Valuation Report for This Property
The Home Valuation Report is an in-depth analysis detailing your home's value as well as a comparison with similar homes in the area
Home Values in the Area
Average Home Value in this Area
Purchase History
| Date | Buyer | Sale Price | Title Company |
|---|---|---|---|
| Stevenson Shawn | $209,000 | Western Title & Escrow Co | |
| English Ross Rebecca | $199,900 | Western Pioneer Title Co | |
| Cunningham John A | $164,500 | American Title Group |
Source: Public Records
Mortgage History
| Date | Status | Borrower | Loan Amount |
|---|---|---|---|
| Open | Stevenson Shawn | $198,550 | |
| Previous Owner | English Ross Rebecca | $159,920 | |
| Previous Owner | Cunningham John A | $159,550 | |
| Closed | English Ross Rebecca | $19,950 |
Source: Public Records
Tax History
| Year | Tax Paid | Tax Assessment Tax Assessment Total Assessment is a certain percentage of the fair market value that is determined by local assessors to be the total taxable value of land and additions on the property. | Land | Improvement |
|---|---|---|---|---|
| 2025 | $4,631 | $266,255 | -- | -- |
| 2024 | $4,515 | $258,500 | -- | -- |
| 2023 | $4,515 | $250,971 | -- | -- |
| 2022 | $4,202 | $243,662 | $0 | $0 |
| 2021 | $4,114 | $236,566 | $0 | $0 |
| 2020 | $3,994 | $229,676 | $0 | $0 |
| 2019 | $3,797 | $222,987 | $0 | $0 |
| 2018 | $3,691 | $210,187 | $0 | $0 |
| 2017 | $3,528 | $210,187 | $0 | $0 |
| 2016 | $3,438 | $204,065 | $0 | $0 |
| 2015 | $3,370 | $198,121 | $0 | $0 |
| 2014 | $3,319 | $192,350 | $0 | $0 |
Source: Public Records
Map
Nearby Homes
- 4114 Jessen Dr
- 2544 Rosebay St
- 3906 Century Dr
- 4070 Barger Dr
- 0 Pacific Hwy W
- 3717 Riviera
- 3820 Dove Ln
- 2055 Devos St
- 1750 Taney St
- 0 E Irwin Way
- 2382 E Irwin Way
- 2093 W Irwin Way
- 1562 Philip St
- 4554 Woodsboro St
- 1519 Taney St
- 4280 Avalon St
- 4800 Barger Dr Unit 60
- 1800 Lakewood Ct Unit 24
- 1800 Lakewood Ct Unit 127
- 1800 Lakewood Ct Unit 158
Your Personal Tour Guide
Ask me questions while you tour the home.