
Seller's Agent in 2025
Jennifer Gross
Coldwell Banker Community REALTORS®
(413) 835-1352
24 in this area
92 Total Sales
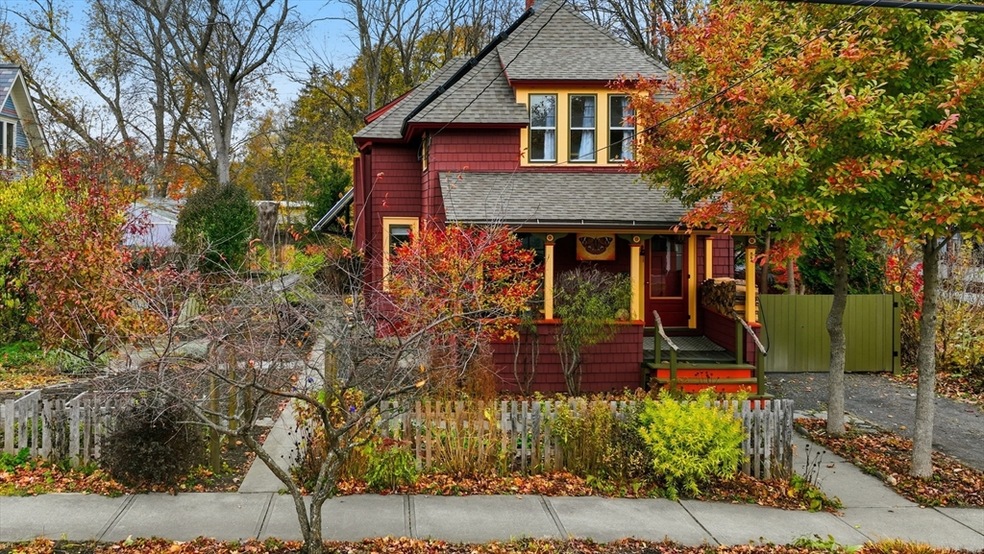
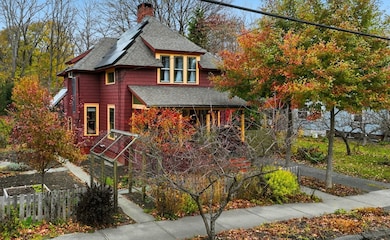
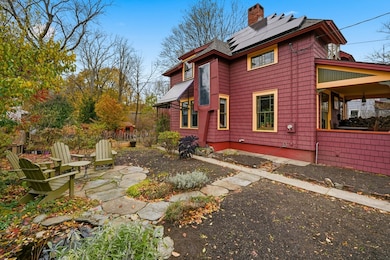
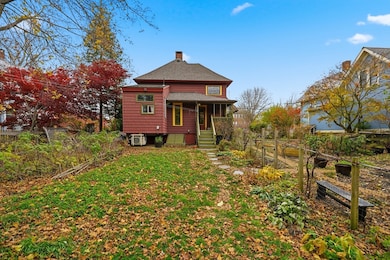
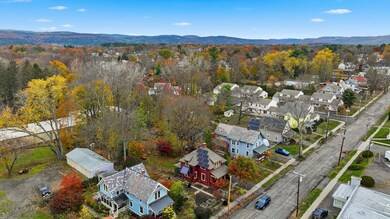
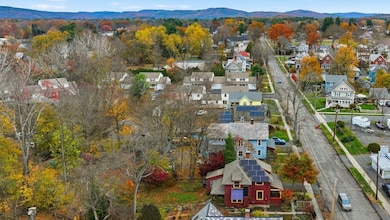
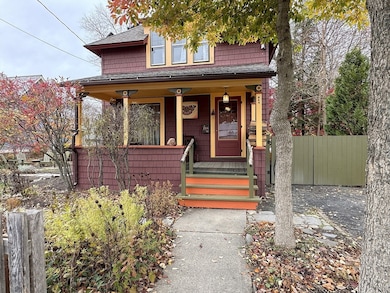
HIGHEST & BEST OFFERS DUE 11/13 5PM! OPEN HOUSE 11/12 4-6PM! This Greenfield home is full of character inside & out, so prepare to be charmed from your first step onto the welcoming front porch. This stylish little gem has been updated over recent years with smart updates like seller owned solar panels, removal of knob & tube wiring, augmented insulation & the addition of 2 mini splits. The roof received 50yr shingles in ‘13 & easy care vinyl siding that looks like shakes was added in ‘21. A tin-ceilinged foyer leads via french doors to the inviting living room with a wood stove that provides warmth to to the entire home during winter months. A sunny dining room adjoins the kitchen w/pantry. An updated bath completes the 1st floor. Upstairs are 3 bdrms, with wood floors. Outside are perennial gardens, full-sun veggie plot, ponds, Goshen Stone patio & a tent platform! A fenced portion of the yard is perfect for pets. Overlooking the back yard is yet another inviting porch.
Last Agent to Sell the Property
Coldwell Banker Community REALTORS® Listed on: 11/10/2025
| Date | Type | Sale Price | Title Company |
|---|---|---|---|
| Quit Claim Deed | $347,553 | -- | |
| Deed | $120,000 | -- | |
| Deed | $120,000 | -- | |
| Deed | -- | -- | |
| Deed | -- | -- | |
| Deed | $141,000 | -- | |
| Deed | $141,000 | -- | |
| Deed | $26,000 | -- |
| Date | Status | Loan Amount | Loan Type |
|---|---|---|---|
| Open | $271,993 | New Conventional | |
| Previous Owner | $115,500 | Stand Alone Refi Refinance Of Original Loan | |
| Previous Owner | $112,800 | Purchase Money Mortgage | |
| Closed | $0 | No Value Available |
| Date | Event | Price | List to Sale | Price per Sq Ft |
|---|---|---|---|---|
| 12/19/2025 12/19/25 | Sold | $347,553 | +16.6% | $232 / Sq Ft |
| 11/13/2025 11/13/25 | Pending | -- | -- | -- |
| 11/10/2025 11/10/25 | For Sale | $298,000 | -- | $199 / Sq Ft |
| Year | Tax Paid | Tax Assessment Tax Assessment Total Assessment is a certain percentage of the fair market value that is determined by local assessors to be the total taxable value of land and additions on the property. | Land | Improvement |
|---|---|---|---|---|
| 2025 | $4,266 | $218,100 | $62,300 | $155,800 |
| 2024 | $4,176 | $204,800 | $50,000 | $154,800 |
| 2023 | $3,787 | $192,700 | $50,000 | $142,700 |
| 2022 | $3,538 | $158,500 | $45,300 | $113,200 |
| 2021 | $3,439 | $148,100 | $44,900 | $103,200 |
| 2020 | $3,128 | $136,400 | $40,900 | $95,500 |
| 2019 | $2,931 | $131,100 | $35,600 | $95,500 |
| 2018 | $2,882 | $128,500 | $34,900 | $93,600 |
| 2017 | $2,792 | $128,500 | $34,900 | $93,600 |
| 2016 | $2,748 | $126,000 | $33,500 | $92,500 |
| 2015 | $2,852 | $126,700 | $37,600 | $89,100 |
| 2014 | $2,607 | $127,000 | $37,600 | $89,400 |
Seller's Agent in 2025
Jennifer Gross
Coldwell Banker Community REALTORS®
(413) 835-1352
24 in this area
92 Total Sales
Buyer's Agent in 2025
Kimberly Raczka
5 College REALTORS® Northampton
(413) 433-7900
8 in this area
253 Total Sales
Source: MLS Property Information Network (MLS PIN)
MLS Number: 73453208
APN: GREE-000082-000057
Disclaimer: Certain information contained herein is derived from information provided by parties other than Homes.com. All information provided is deemed reliable, but is not guaranteed to be accurate and should be independently verified.
![]() The property listing data and information, or the Images, set forth herein were provided to MLS Property Information Network, Inc. from third party sources, including sellers, lessors and public records, and were compiled by MLS Property Information Network, Inc. The property listing data and information, and the Images, are for the personal, non-commercial use of consumers having a good faith interest in purchasing or leasing listed properties of the type displayed to them and may not be used for any purpose other than to identify prospective properties which such consumers may have a good faith interest in purchasing or leasing. MLS Property Information Network, Inc. and its subscribers disclaim any and all representations and warranties as to the accuracy of the property listing data and information, or as to the accuracy of any of the Images, set forth herein.
The property listing data and information, or the Images, set forth herein were provided to MLS Property Information Network, Inc. from third party sources, including sellers, lessors and public records, and were compiled by MLS Property Information Network, Inc. The property listing data and information, and the Images, are for the personal, non-commercial use of consumers having a good faith interest in purchasing or leasing listed properties of the type displayed to them and may not be used for any purpose other than to identify prospective properties which such consumers may have a good faith interest in purchasing or leasing. MLS Property Information Network, Inc. and its subscribers disclaim any and all representations and warranties as to the accuracy of the property listing data and information, or as to the accuracy of any of the Images, set forth herein.
Ask me questions while you tour the home.