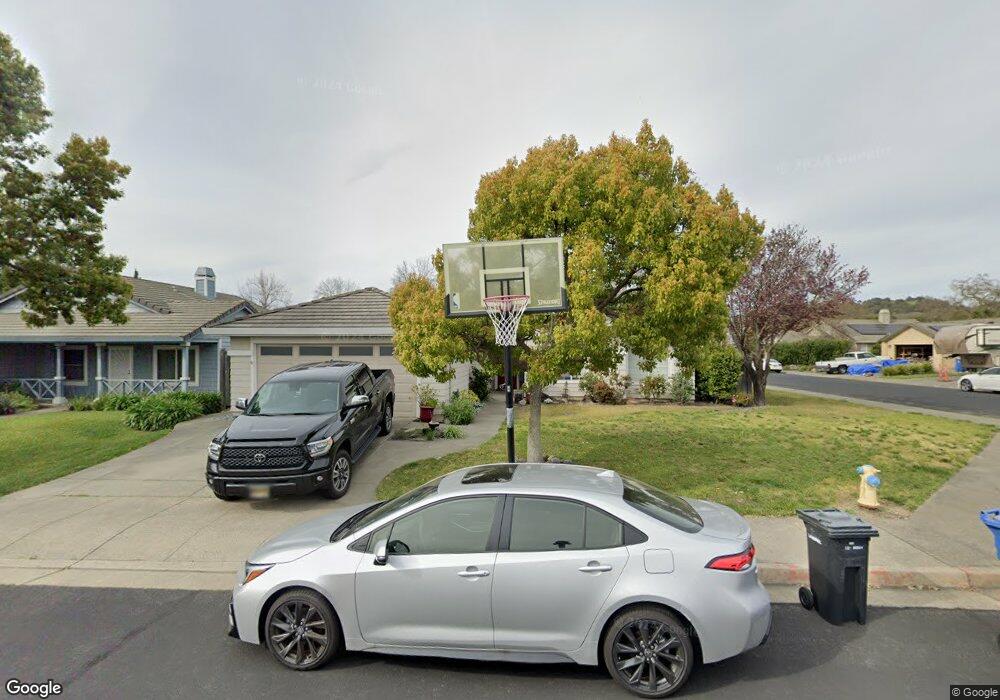
254 Persimmon Dr Windsor, CA 95492
Estimated Value: $755,000 - $812,000
4
Beds
2
Baths
1,557
Sq Ft
$504/Sq Ft
Est. Value
About This Home
This home is located at 254 Persimmon Dr, Windsor, CA 95492 and is currently estimated at $784,212, approximately $503 per square foot. 254 Persimmon Dr is a home located in Sonoma County with nearby schools including Mattie Washburn Elementary School, Brooks Elementary School, and Windsor Middle School.
Ownership History
Date
Name
Owned For
Owner Type
Purchase Details
Closed on
May 26, 2010
Sold by
Reddin Patricia M
Bought by
Brown Haywood William and Brown Nancy W
Current Estimated Value
Home Financials for this Owner
Home Financials are based on the most recent Mortgage that was taken out on this home.
Original Mortgage
$392,000
Outstanding Balance
$263,492
Interest Rate
5.03%
Mortgage Type
VA
Estimated Equity
$520,720
Purchase Details
Closed on
Sep 18, 1997
Sold by
Holloway Donald L and Holloway Marilyn
Bought by
Reddin Graham S and Reddin Patricia M
Purchase Details
Closed on
Feb 18, 1994
Sold by
Kaufman & Broad South Bay Inc
Bought by
Holloway Donald L and Holloway Marilyn
Home Financials for this Owner
Home Financials are based on the most recent Mortgage that was taken out on this home.
Original Mortgage
$149,560
Interest Rate
6.98%
Create a Home Valuation Report for This Property
The Home Valuation Report is an in-depth analysis detailing your home's value as well as a comparison with similar homes in the area
Home Values in the Area
Average Home Value in this Area
Purchase History
| Date | Buyer | Sale Price | Title Company |
|---|---|---|---|
| Brown Haywood William | $396,000 | Fidelity National Title Co | |
| Reddin Graham S | $205,500 | First American Title | |
| Holloway Donald L | $187,000 | First American Title |
Source: Public Records
Mortgage History
| Date | Status | Borrower | Loan Amount |
|---|---|---|---|
| Open | Brown Haywood William | $392,000 | |
| Previous Owner | Holloway Donald L | $149,560 |
Source: Public Records
Tax History
| Year | Tax Paid | Tax Assessment Tax Assessment Total Assessment is a certain percentage of the fair market value that is determined by local assessors to be the total taxable value of land and additions on the property. | Land | Improvement |
|---|---|---|---|---|
| 2025 | $6,075 | $511,021 | $154,892 | $356,129 |
| 2024 | $6,075 | $501,002 | $151,855 | $349,147 |
| 2023 | $6,075 | $491,179 | $148,878 | $342,301 |
| 2022 | $5,856 | $481,549 | $145,959 | $335,590 |
| 2021 | $5,762 | $472,108 | $143,098 | $329,010 |
| 2020 | $5,888 | $467,268 | $141,631 | $325,637 |
| 2019 | $5,852 | $458,106 | $138,854 | $319,252 |
| 2018 | $5,794 | $449,125 | $136,132 | $312,993 |
| 2017 | $5,739 | $440,319 | $133,463 | $306,856 |
| 2016 | $5,375 | $431,687 | $130,847 | $300,840 |
| 2015 | $5,227 | $425,204 | $128,882 | $296,322 |
| 2014 | $4,954 | $400,000 | $121,000 | $279,000 |
Source: Public Records
Map
Nearby Homes
- 719 Hackberry Ct
- 1276 Jensen Ln Unit LOT 2
- 1276 Jensen Ln Unit LOT 1
- 1276 Jensen Ln Unit LOT 3
- 127 Pleasant Ave
- 179 Pleasant Ave
- 365 Alden Ct
- 9636 Lakewood Dr
- 6516 Hwy
- 327 Blazing Star Ct
- 155 Amanda Way
- 159 Amanda Way
- 145 Amanda Way
- 149 Amanda Way
- 125 Anish Way
- 198 Valencia Way
- 203 Cockrobin Ave
- 156 Cornell St
- 172 Cornell St
- 133 Bluebird Dr
- 250 Persimmon Dr
- 848 Elderberry St
- 842 Elderberry St
- 242 Persimmon Dr
- 924 Ginkgo Place
- 930 Ginkgo Place
- 836 Elderberry St
- 255 Persimmon Dr
- 936 Ginkgo Place
- 918 Ginkgo Place
- 249 Persimmon Dr
- 230 Persimmon Dr
- 243 Persimmon Dr
- 912 Ginkgo Place
- 942 Ginkgo Place
- 830 Elderberry St
- 237 Persimmon Dr
- 206 Persimmon Dr
- 906 Ginkgo Place
- 849 Elderberry St
Your Personal Tour Guide
Ask me questions while you tour the home.