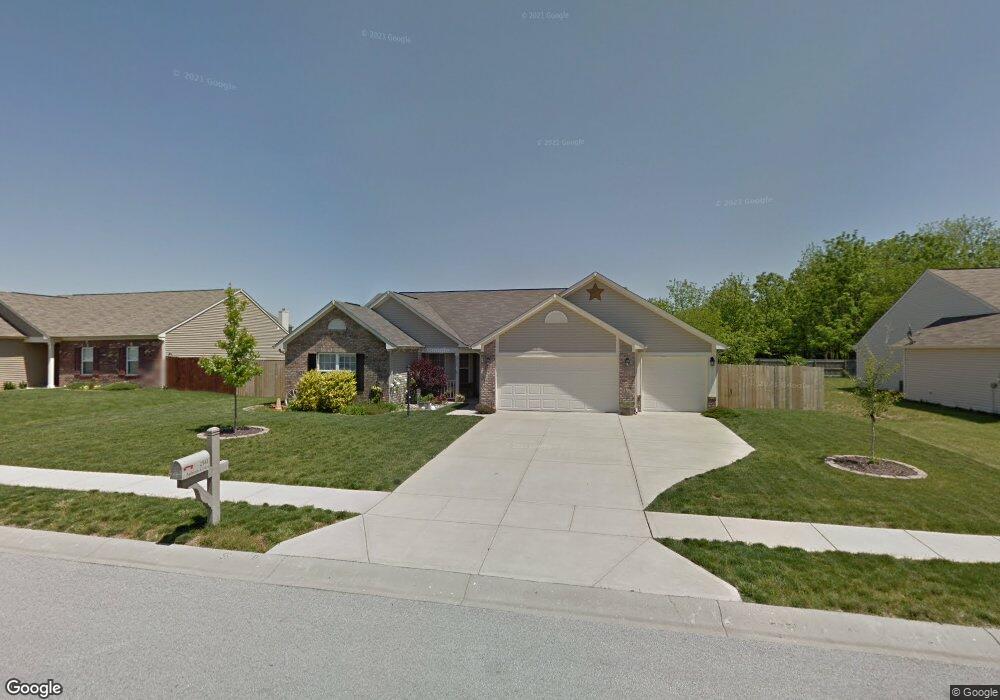
2541 Auburn Ct Plainfield, IN 46168
Estimated Value: $315,000 - $328,000
3
Beds
2
Baths
1,670
Sq Ft
$192/Sq Ft
Est. Value
About This Home
This home is located at 2541 Auburn Ct, Plainfield, IN 46168 and is currently estimated at $320,422, approximately $191 per square foot. 2541 Auburn Ct is a home located in Hendricks County with nearby schools including White Oak Elementary School, Cedar Elementary School, and Avon Intermediate School West.
Ownership History
Date
Name
Owned For
Owner Type
Purchase Details
Closed on
Sep 22, 2008
Sold by
First Franklin Financial Corporation
Bought by
Hiatt Michael J and Hiatt Ashley B
Current Estimated Value
Home Financials for this Owner
Home Financials are based on the most recent Mortgage that was taken out on this home.
Original Mortgage
$143,010
Interest Rate
6.43%
Mortgage Type
VA
Purchase Details
Closed on
Apr 17, 2008
Sold by
Philipanec Labert and Auburn Meadows Property Owners
Bought by
First Franklin Financial Corp
Purchase Details
Closed on
Jul 31, 2006
Sold by
Westport Homes Inc
Bought by
Philipance Albert
Home Financials for this Owner
Home Financials are based on the most recent Mortgage that was taken out on this home.
Original Mortgage
$176,783
Interest Rate
10.4%
Mortgage Type
Adjustable Rate Mortgage/ARM
Create a Home Valuation Report for This Property
The Home Valuation Report is an in-depth analysis detailing your home's value as well as a comparison with similar homes in the area
Home Values in the Area
Average Home Value in this Area
Purchase History
| Date | Buyer | Sale Price | Title Company |
|---|---|---|---|
| Hiatt Michael J | -- | None Available | |
| First Franklin Financial Corp | $120,784 | None Available | |
| Philipance Albert | -- | None Available |
Source: Public Records
Mortgage History
| Date | Status | Borrower | Loan Amount |
|---|---|---|---|
| Previous Owner | Hiatt Michael J | $143,010 | |
| Previous Owner | Philipance Albert | $176,783 |
Source: Public Records
Tax History Compared to Growth
Tax History
| Year | Tax Paid | Tax Assessment Tax Assessment Total Assessment is a certain percentage of the fair market value that is determined by local assessors to be the total taxable value of land and additions on the property. | Land | Improvement |
|---|---|---|---|---|
| 2024 | $2,307 | $256,000 | $47,100 | $208,900 |
| 2023 | $2,013 | $235,000 | $42,800 | $192,200 |
| 2022 | $2,142 | $232,400 | $41,900 | $190,500 |
| 2021 | $1,912 | $203,500 | $39,300 | $164,200 |
| 2020 | $1,753 | $193,000 | $39,300 | $153,700 |
| 2019 | $1,534 | $179,100 | $37,400 | $141,700 |
| 2018 | $1,582 | $174,400 | $37,400 | $137,000 |
| 2017 | $1,301 | $166,900 | $36,000 | $130,900 |
| 2016 | $1,294 | $162,700 | $36,000 | $126,700 |
| 2014 | $1,165 | $159,000 | $35,300 | $123,700 |
Source: Public Records
Map
Nearby Homes
- 2434 Burgundy Way
- 6900 Barberry Ct
- 6589 Avalon Blvd
- 7128 Verwood Ct
- 6862 Trailside Dr
- 0 S Avon Ave Unit MBR22032323
- 1914 Delp Ct
- 7315 Hidden Valley Dr
- 1914 S State Rd
- 7370 Hidden Valley Dr
- 7356 Oakview Dr
- 6374 Timberbluff Cir
- 7686 Rolling Green Dr
- 6229 Catalpa Dr
- 6012 Yellow Birch Ct
- 7440 Oakview Dr
- 1810 Salina Dr
- 6013 Yellow Birch Ct
- 1829 Bentbrook Dr
- 7574 Williamsburg Dr
- 2551 Auburn Ct
- 2531 Auburn Ct
- 6806 Old Persimmon Ct
- 2503 Burgundy Way
- 2561 Auburn Ct
- 2560 Auburn Ct
- 6790 Old Persimmon Ct
- 2520 Auburn Ct
- 2489 Burgundy Way
- 2571 Auburn Ct
- 2570 Auburn Ct
- 2500 Auburn Way
- 2477 Burgundy Way
- 6776 Old Persimmon Ct
- 6777 Old Persimmon Ct
- 2581 Auburn Ct
- 2513 Auburn Way
- 2504 Burgundy Way
- 2495 Burgundy Way
- 6808 Crocus Ct