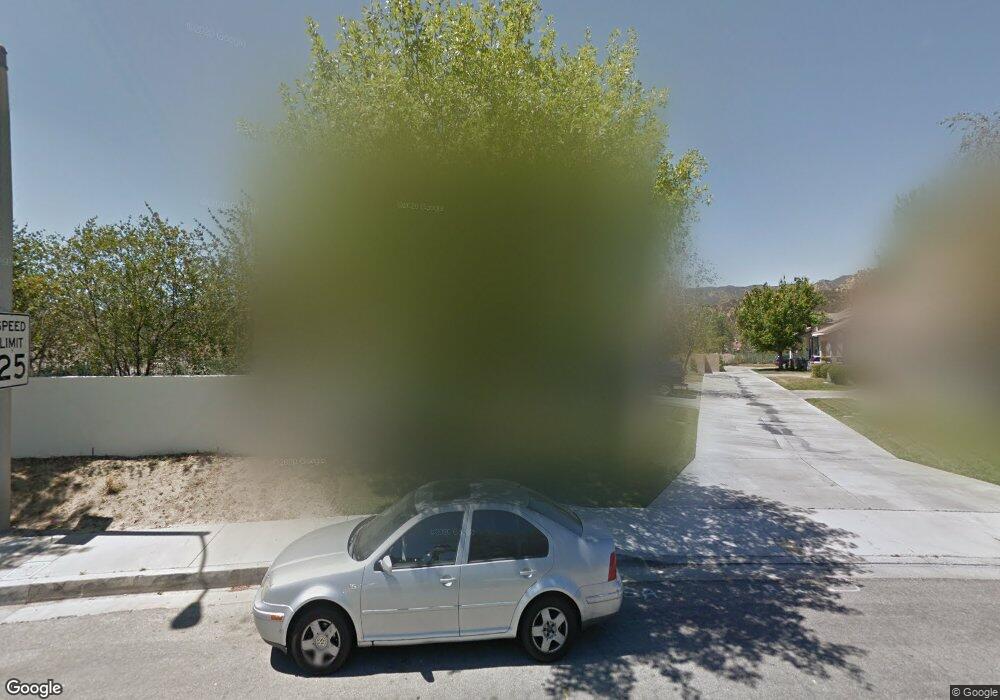
25410 Chisom Ln Stevenson Ranch, CA 91381
Estimated Value: $856,719 - $974,000
4
Beds
3
Baths
1,810
Sq Ft
$513/Sq Ft
Est. Value
About This Home
This home is located at 25410 Chisom Ln, Stevenson Ranch, CA 91381 and is currently estimated at $928,180, approximately $512 per square foot. 25410 Chisom Ln is a home located in Los Angeles County with nearby schools including Pico Canyon Elementary School, Rancho Pico Junior High School, and West Ranch High School.
Ownership History
Date
Name
Owned For
Owner Type
Purchase Details
Closed on
Apr 17, 1997
Sold by
West Venture
Bought by
Arguelles Alfredo A and Arguelles Marty Verna S
Current Estimated Value
Home Financials for this Owner
Home Financials are based on the most recent Mortgage that was taken out on this home.
Original Mortgage
$204,400
Outstanding Balance
$26,984
Interest Rate
8.13%
Estimated Equity
$901,196
Purchase Details
Closed on
Sep 13, 1994
Sold by
Dale Poe Development Corp
Bought by
West Venture
Home Financials for this Owner
Home Financials are based on the most recent Mortgage that was taken out on this home.
Original Mortgage
$6,300,000
Interest Rate
7.47%
Create a Home Valuation Report for This Property
The Home Valuation Report is an in-depth analysis detailing your home's value as well as a comparison with similar homes in the area
Home Values in the Area
Average Home Value in this Area
Purchase History
| Date | Buyer | Sale Price | Title Company |
|---|---|---|---|
| Arguelles Alfredo A | $215,500 | Continental Lawyers Title Co | |
| West Venture | $3,140,000 | Chicago Title Co |
Source: Public Records
Mortgage History
| Date | Status | Borrower | Loan Amount |
|---|---|---|---|
| Open | Arguelles Alfredo A | $204,400 | |
| Previous Owner | West Venture | $6,300,000 |
Source: Public Records
Tax History
| Year | Tax Paid | Tax Assessment Tax Assessment Total Assessment is a certain percentage of the fair market value that is determined by local assessors to be the total taxable value of land and additions on the property. | Land | Improvement |
|---|---|---|---|---|
| 2025 | $5,808 | $350,142 | $140,054 | $210,088 |
| 2024 | $5,808 | $343,277 | $137,308 | $205,969 |
| 2023 | $5,628 | $336,547 | $134,616 | $201,931 |
| 2022 | $5,518 | $329,949 | $131,977 | $197,972 |
| 2021 | $5,384 | $323,481 | $129,390 | $194,091 |
| 2019 | $5,200 | $313,888 | $125,553 | $188,335 |
| 2018 | $4,978 | $307,735 | $123,092 | $184,643 |
| 2016 | $4,707 | $295,787 | $118,313 | $177,474 |
| 2015 | $4,606 | $291,345 | $116,536 | $174,809 |
| 2014 | $4,415 | $285,639 | $114,254 | $171,385 |
Source: Public Records
Map
Nearby Homes
- 25463 Hardy Place
- 25546 Hardy Place
- 25535 Chisom Ln
- 25308 Joyce Place
- 25417 Magnolia Ln
- 27632 Ensemble Place
- 27120 Red Tail Place
- 25554 Schubert Cir
- 25530 Hemingway Ave
- 25803 Anderson Ln
- 26729 Greylock Ln
- 27120 Valley Oak Place
- 27516 Golden Currant Place
- 27422 Pioneer Ct
- 26973 Prospector Rd Unit 302
- 27226 Red Willow Ct
- 26976 Prospector Rd Unit 201
- 27525 Illumination Ct
- 25152 Steinbeck Ave Unit B
- 25558 Fitzgerald Ave
- 25408 Chisom Ln
- 25402 Chisom Ln
- 25404 Chisom Ln
- 25417 Chisom Ln
- 25403 Chisom Ln
- 25539 Chase St
- 25406 Chisom Ln
- 25426 Chisom Ln
- 25431 Chisom Ln
- 25547 Chase St
- 25433 Chisom Ln
- 25430 Chisom Ln
- 25526 Chase St
- 25520 Chase St
- 25532 Chase St
- 25437 Chisom Ln
- 25435 Chisom Ln
- 25503 Crockett Ln
- 25440 Chisom Ln
- 25538 Chase St
Your Personal Tour Guide
Ask me questions while you tour the home.